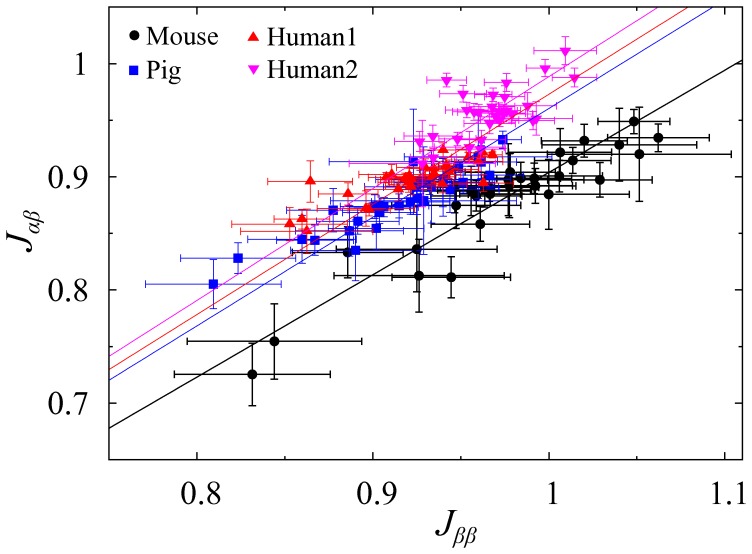
Figure 5. Cellular attractions in mouse, pig, and human islets.
Relative attractions between cell types and their uncertainties are inferred from three-dimensional islet structures. Symbols represent individual islets: mouse (black circle), pig (blue square), and human islets (red triangle and pink inverse triangle). Each species has n = 30 islets. In particular, two sets of n = 30 islets are provided from two human (Human1 and Human2) subjects. The relationship between  and
and  is fitted with linear functions,
  , represented by solid lines with colors corresponding to each species. Note that the attraction between
  cells is defined as a reference attraction,
  .
.

