
Figure 6. Results of iterative Kaplan-Meier Analysis in each invasiveness cohort.
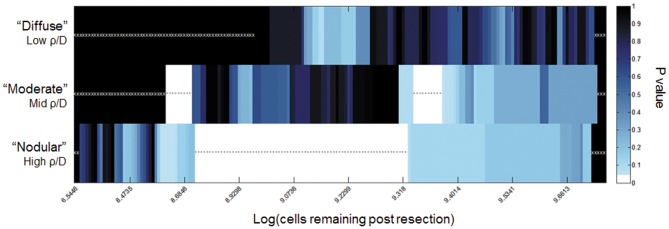
Number of cells remaining was calculated for each patient, based on their ρ/D and measured residual enhancing disease. Each possible threshold was iterated through to separate the patients into large and small residual tumor cell population cohorts. White boxes correspond to thresholds separating patients into groups with significantly different (p<0.05) survival. White stars indicate tests with no p-value, as the threshold did not separate the patients in the given invasiveness cohort into two groups. Black asterisks indicate tests with p<0.05. Black bins with white x's indicate no the threshold did not separate the patients in the given invasiveness cohort into two groups. For example, for the diffuse case (Figure 3, top row), the black bins with white x's represent the fact that even GTR was unable to achieve a remaining cell burden less than the cutoff (up to approximately 109). Further, amongst the most diffuse gliomas, no threshold for a residual cells following resection was found to be significant of outcome represented visually as the lack of a white bar in the top row. Although less dramatic, the moderate cohort was unable to equate a GTR with <108.5 cells remaining represented by the black bars with white x's to the left on middle row of Figure 3. While resection of tumors in the nodular cohort were able to attain residual disease burdens at all levels down to <107 cells.