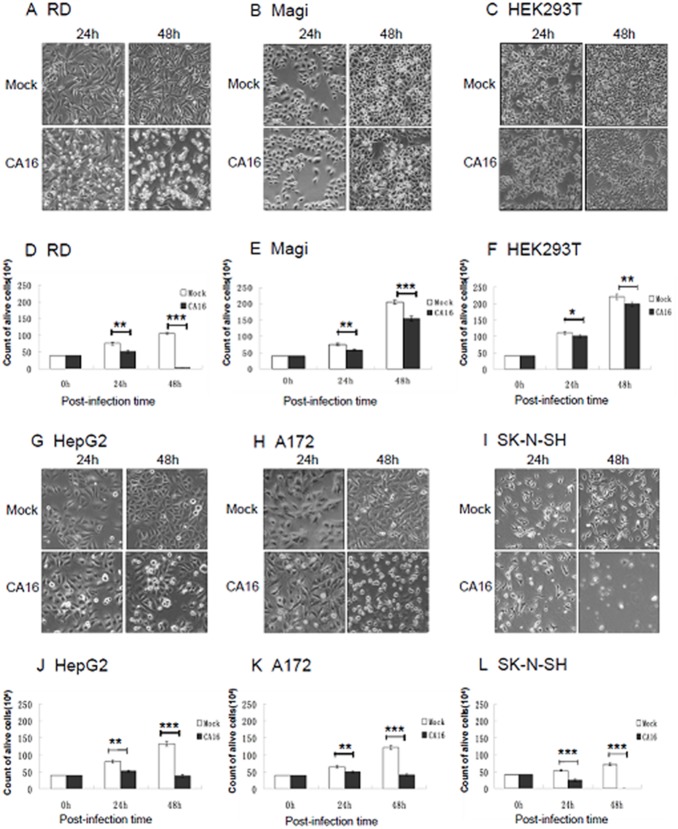
Figure 1. CA16 induces CPEs in both neural and non-neural cells.
Different cell lines were inoculated with CA16 SHZH05 virus at the MOI of 0.2 or DMEM as a negative control. At 24 h and 48 h post-infection, cells were imaged via light microscopy, stained with Trypan Blue and counted. Representative images of (A) RD, (B) Magi, (C) HEK293T, (G) HepG2, (H) A172 and (I) SK-N-SH cell lines are shown of three individual experiments performed for each cell line. Counts of live (D) RD, (E) Magi, (F) HEK293T, (J) HepG2, (K) A172 and (L) SK-N-SH cells (n = 3) were statistically analyzed for differences between infected and control groups. *P<0.05, **P<0.01, ***P<0.001.

