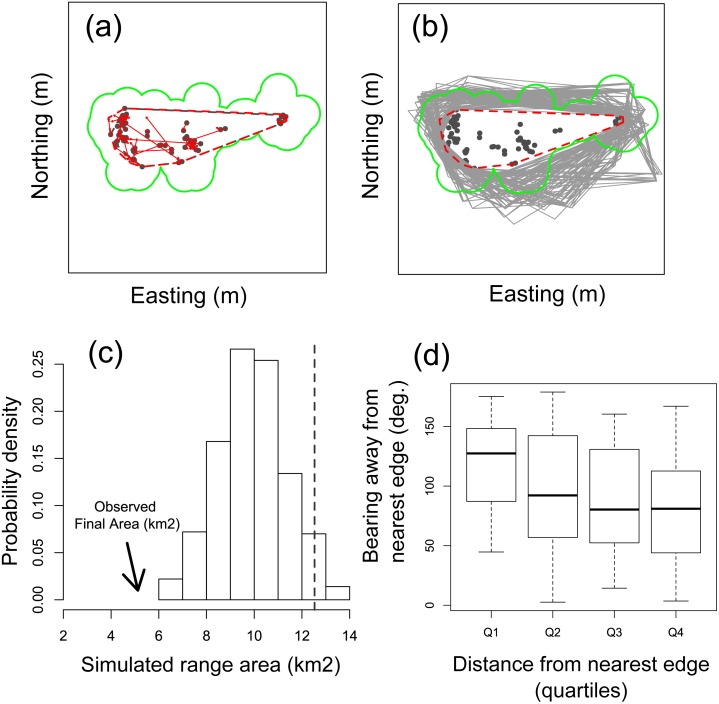
Figure 5. Movement patterns of giant tortoises reintroduced to Española Island, Galapagos.
Closed circles in (A) and (B) represent the initial locations of all tortoises captured from 2000 to 2003 that were later recaptured. Arrows in (A) represent observed movement distances and directions. Minimum convex polygons (MCP) enclose the initial locations (grey) and initial plus final locations (red; differences represent the observed range expansion resulting from the observed movements). The grey polygons in (B) depict hypothetical MCPs (n = 500) for which initial locations have been decoupled from observed movement distances and directions. The observed final range area was smaller than all resulting hypothetical MCPs (C). In fact, those tortoises nearest to the range margins exhibited a strong tendency to move away from the nearest edge (D).

