
Figure 2. Dose response curve of forskolin on forward motility of mature caprine spermatozoa.
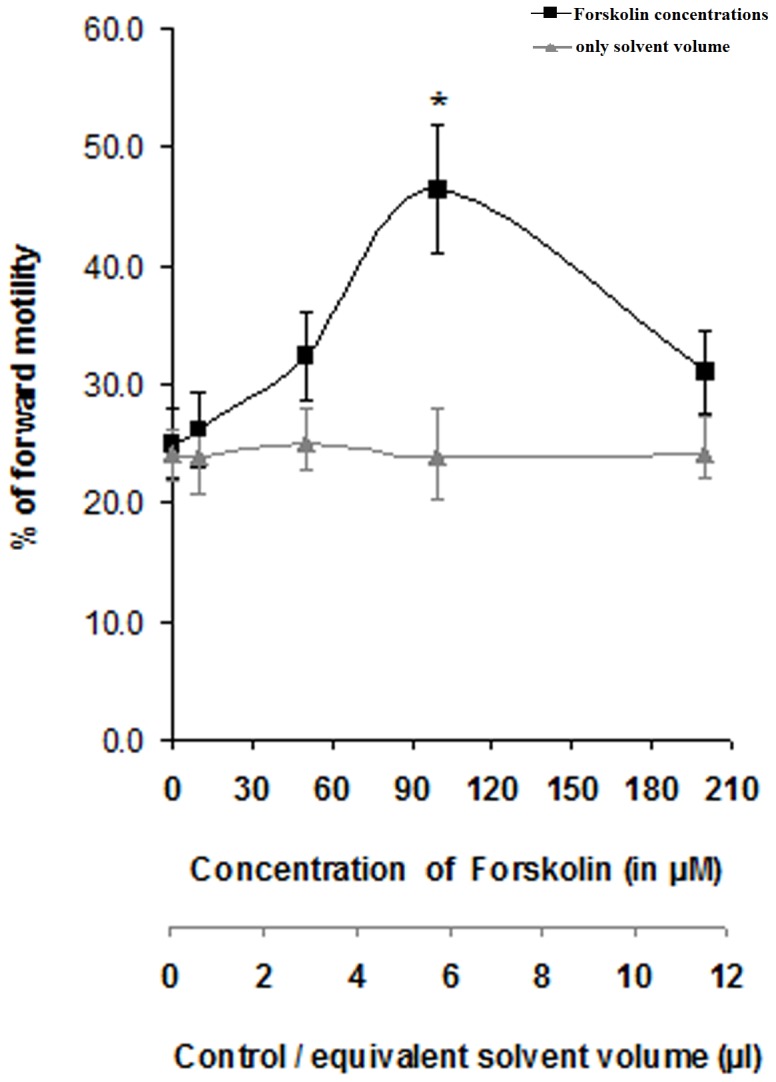
Primary X- axis denotes graduations for applied Forskolin concentrations; secondary X-axis denotes graduations for control curve where equivalent amounts of solvent of Forskolin that were applied to produce treatment points, were used. The data represent mean ± SEM for n = 3 samples. Asterisk (*) denotes statistically significant difference vs. control (p<0.05). Viable cell count throughout the different assay conditions remained ≥97%.