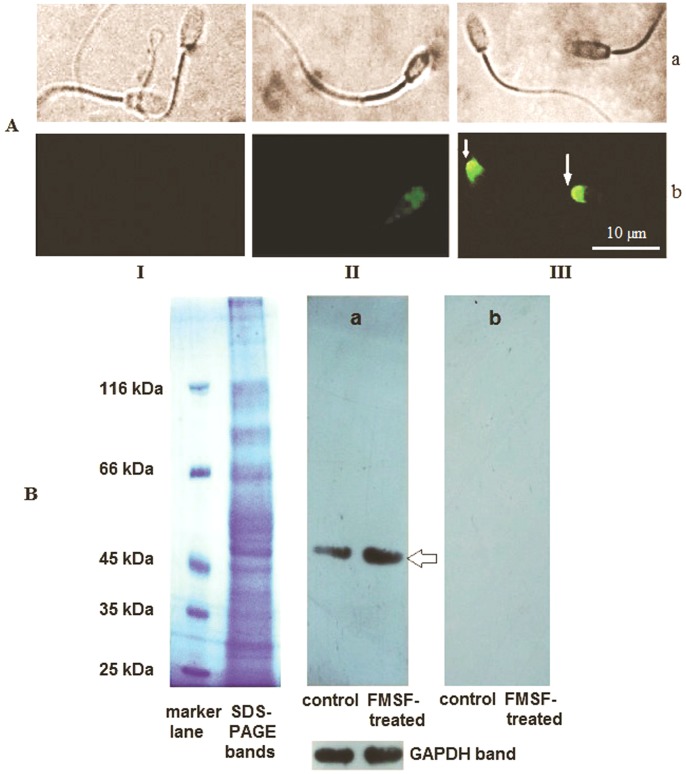
Figure 8. Immuno-localization of Tyrosine-phosphorylation site, (A).
Panel a: Bright-field images, Panel b: Fluorescent images; I- Protein A-FITC only control, II- untreated, III- FMSF (0.5 µM; incubation time 10 min). White arrows indicate sperm head where enhanced phosphorylation was observed. The figure is representative of different such views and was taken at 600× magnification. B. Western blot profile of tyrosine-phosphorylated protein. Electrophoresis was done in 10% denaturing polyacrylamide gel. FMSF dose: 0.5 µM/incubation time 10 min. The MW markers used were beta-galactosidase (116 kDa), bovine serum albumin (66.2 kDa), ovalbumin (45.0 kDa), lactate dehydrogenase (35.0 kDa), REase Bsp98I (25 kDa). The set of bands with differential profile has only been shown. The SDS-PAGE band is of whole cell lysate; panels (a) and (b) correspond to developed Western blot of whole cell lysate protein and membrane protein fraction, respectively. Arrow indicates the detected ≈ 50 kDa band.

