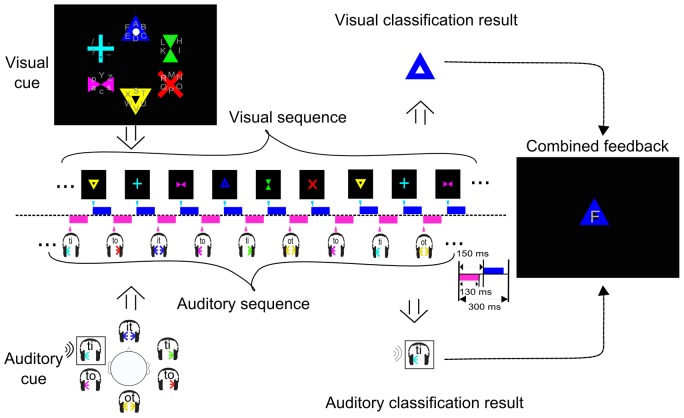
Figure 2. Visualization of the experimental design of the experiment for Parallel-Speller (V*A).
Six symbols locate in each group, making a total of thirty-six symbols. The presentation of the visual stimuli was used to choose the group the symbol was in. The position of the symbol in the group was selected through the auditory domain. The upper panel shows the sequence of visual target selection, and the lower panel shows that of the auditory target selection.

