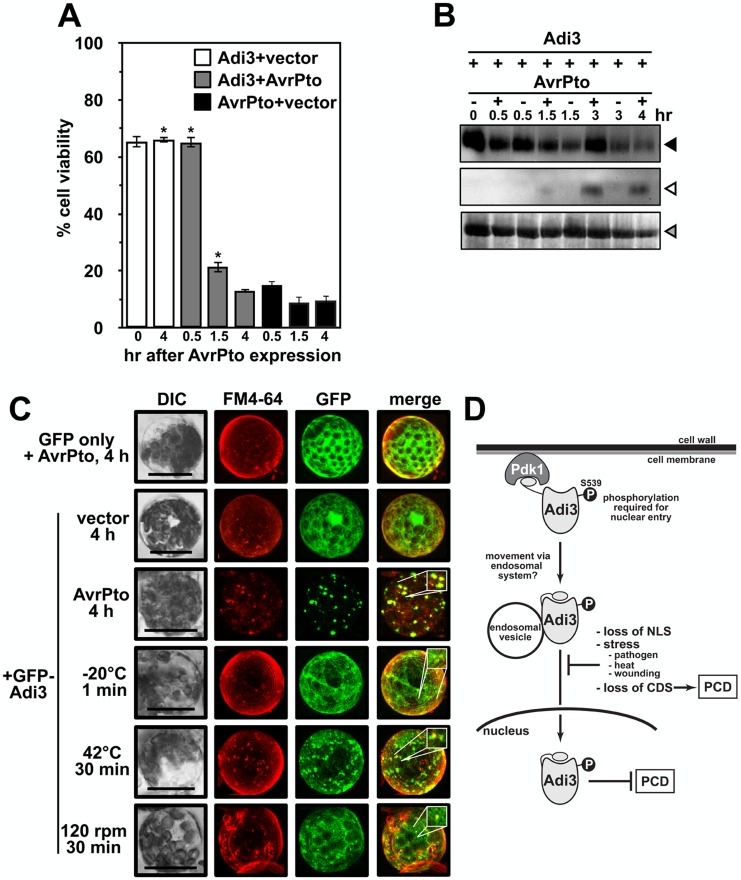
Figure 4. Stress induced endosomal localization of Adi3.
A, AvrPto-induced cell death in PtoR protoplasts. GFP-Adi3 expressing protoplasts were transformed with an avrPto-FLAG construct and cell death monitored for 4 hrs with Evans blue. B, α-GFP western blot for GFP-Adi3 and α-FLAG western for AvrPto-FLAG expression in PtoR tomato protoplasts from A. Filled triangle, GFP-Adi3; open triangle, AvrPto-FLAG; gray triangle, RuBisCo loading control. C, GFP-Adi3 localization in response to stresses. PtoR protoplasts expressing GFP-Adi3 for 16 hrs were exposed to pathogen stress (AvrPto-FLAG expression), cold stress (−20°C), heat stress (42°C) and wounding (shaking at 120 rpm), FM4-64 (20 µM) stained for 2 hrs, and visualized by confocal microscopy. Inlays show zoom of region of interest. Bar = 20 µm. D, A model for Adi3 function in CDS and loss of Adi3 CDS in response to stress. See text for details.

