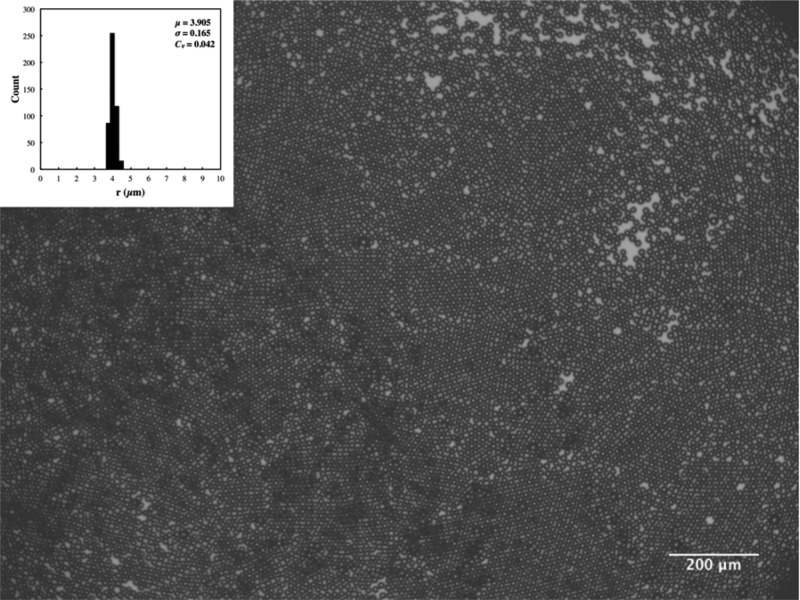
Figure 6.
Micrograph of monodisperse microbubbles produced using a solution containing 1 mg mL–1 oleosin and 10 mg mL–1 (PEO)78-(PPO)30-(PEO)78 and collected into a well in the PDMS device without the use of plastic tubing. The inset shows the microbubble size distribution for ∼500 microbubbles. μ, σ, and Cv in the inset represent the average (in μm), standard deviation (in μm), and coefficient of variation, respectively.

