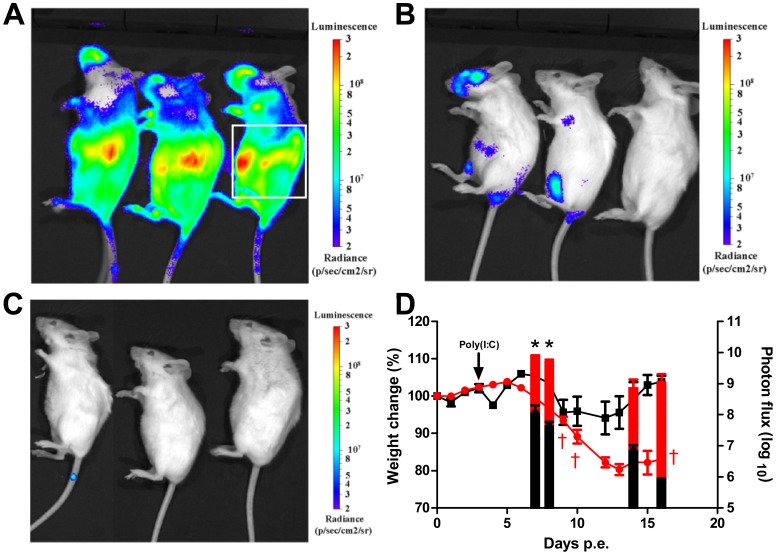
Figure 2. Influence of Poly(I:C) treatment on viral dissemination evaluated by in-vivo bioluminescence imaging.
BALB/c mice were infected with 2 i.n. ECTV-Luc LD50 and left untreated (n = 5) or treated with poly(I:C) on day 3 p.e. (n = 3). (A) Infected untreated mice 8 days p.e. (B) Infected mice treated on day 3 p.e. with poly(I:C) and imaged on day 8 p.e. (C) Poly(I:C) treated group on day 3 p.e. imaged on day 16 p.e. Bioluminescent images were obtained using an f/stop of 1, binning factor of 4, and acquisition time of 1 sec (A, B) or 40 sec (C). Relative photon flux expression is represented by a pseudocolor heat map. (D) Morbidity, based on weight change (lines, left Y axis) and bioluminescence signal on days 7, 8, 14 and 16 p.e. (bars, right Y axis) of the groups shown in panels A–C (red for infected untreated, black for poly(I:C) treated on day 3 p.e.). Bioluminescent signal intensity as total photon flux (photon/s/cm2/sr), was calculated by region of interest (ROI) analysis on the chest and abdomen area marked by a white box on the right mouse in panel (A). Same ROI was used for all mice examined. Asterisk denote for significant reduction in photon flux (n = 3–5 in each group, P<0.05). Dagger represent dead mice.

