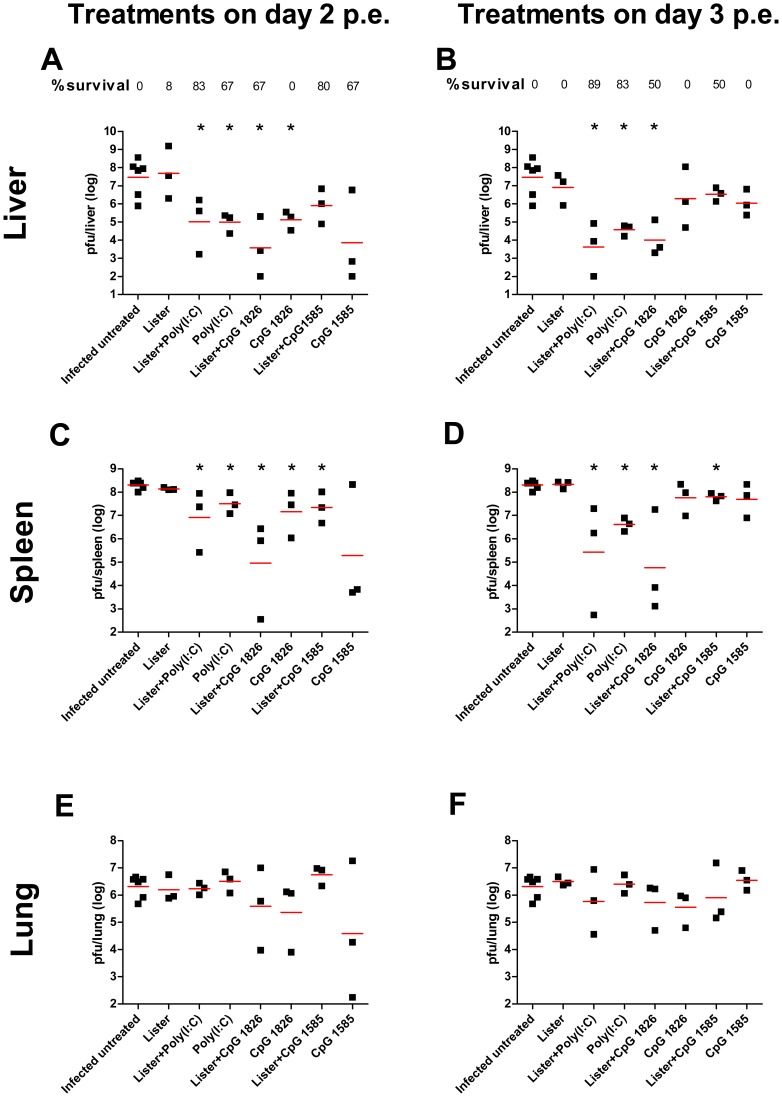
Figure 3. Viral load following postexposure treatments.
Viral loads were determined by plaque assay from BALB/c mice 8 days postexposure (p.e.) following infection with 18 i.n. ECTV LD50. (A, C, E) viral load in livers, spleens and lungs of mice treated on day 2 p.e. (B, D, E) viral load in livers, spleens and lungs of mice treated on day 3 p.e. Horizontal lines represent the geometric mean of each group. Survival proportions of each group are designated. Asterisk denote for significant reduction in viral load (n = 3 in each treated group) compared to the infected untreated group (n = 6, P<0.05).

