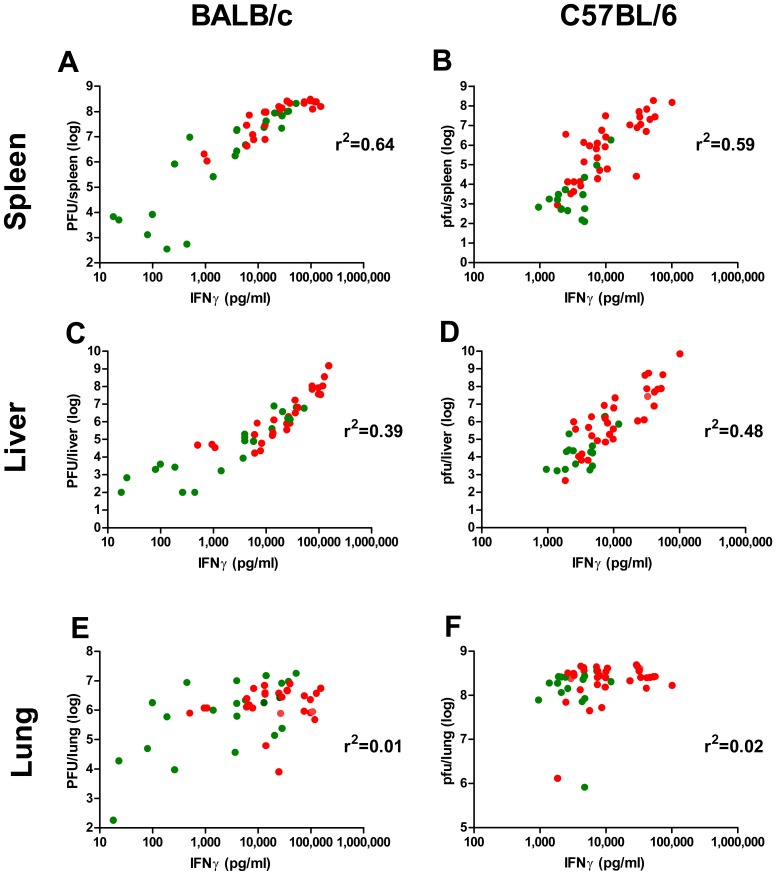
Figure 5. Correlation between IFNγ and viral load.
(A, C, E) Viral loads and IFNγ levels in BALB/c mice infected with 18 i.n. ECTV LD50, untreated (n = 6) or single treated on day 2 or 3 with: poly(I:C) with or without VACV-Lister, CpG-ODNs 1585 and 1826 with or without VACV-Lister and VACV-Lister only (n = 3/group). (B, D, F) Viral loads and IFNγ levels in C57BL/6j mice infected with 2–3 i.n. ECTV LD50, untreated (n = 6) or single treated on day 0 with: poly(I:C) with or without VACV-Lister, VACV-Lister or placebo; day 1: poly(I:C) with or without VACV-Lister or MVA, VACV-Lister or MVA, placebo; day 2: poly(I:C) with or without MVA (n = 3/group), MVA or placebo (n = 3/group). (A, B) spleens; (C, D) livers and (E, F) lungs. Green dots - examined mice from groups in which the survival rate was 50% and above. Red dots - examined mice from groups in which the survival rate was less than 50%, (n = 48 for either BALB/c or C57BL/6j).

