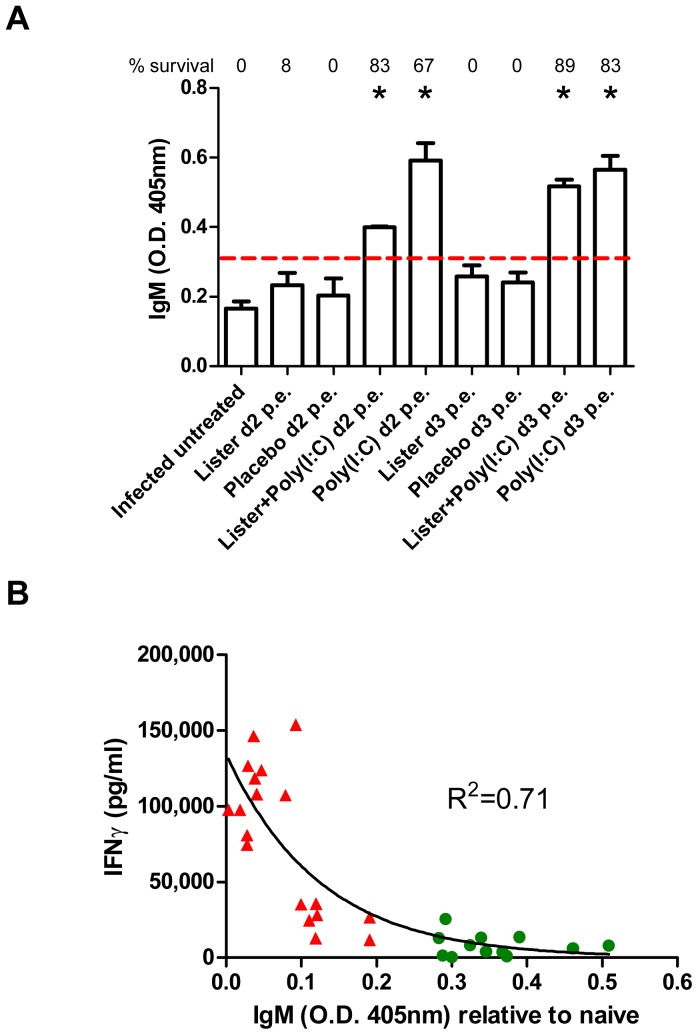
Figure 7. Correlation of IgM levels and treatment efficacy.
(A) IgM level in the sera of BALB/c mice collected 8 days post i.n. infection with 18 LD50 of ECTV was determined by ELISA. Survival proportions of each group are designated above each bar. Asterisk denote for significant difference compared to the infected untreated group (P<0.01, n = 6 in the infected untreated group, n = 3 in the treated groups, t-test). Dotted line represent limit of detection. (B) Correlation between IFNγ and IgM levels of the mice presented in panel A. Green circles - examined mice from groups in which the survival rate was 50% and above. Red triangles - examined mice from groups in which the survival rate was less than 50%. R2 value represents a non-linear fit.

