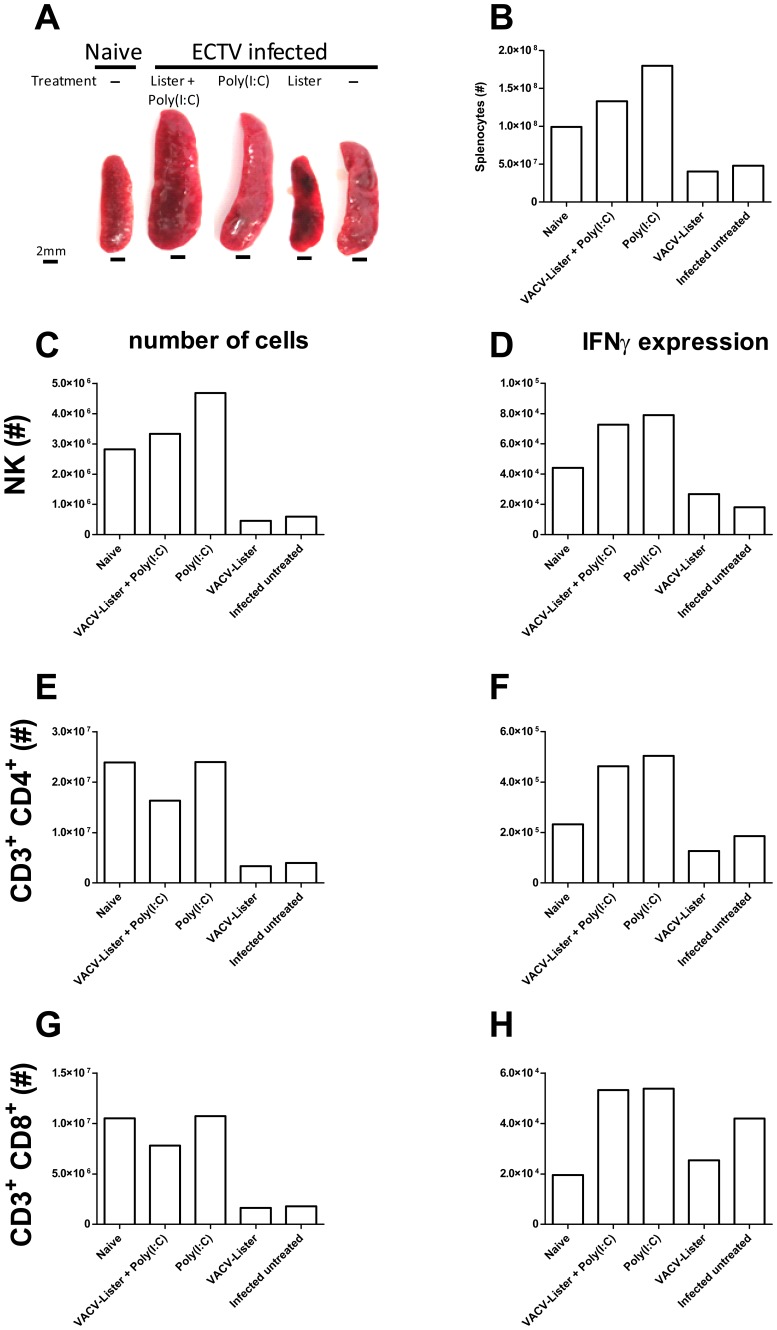
Figure 8. Cellular-immune response following p.e. treatment.
BALB/c mice were infected with 4 i.n. ECTV LD50, left untreated or treated on day 3 p.e. and their spleens were photographed (A) and analyzed by flow-cytometry for the distribution and activation (intracellular IFNγ) of various cell populations. (B) Counting of viable lymphocytes was performed under light microscope. (C–H) Number of total and activated cells of the different cell populations: NK (C, D), of CD3+ CD4+ (E, F) and CD3+ CD8+ (G, H) cells, respectively.

