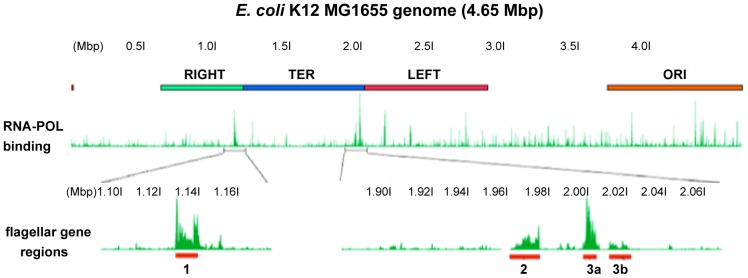
Figure 1. Location and expression of the E. coli flagellar regions.

The E. coli K12 MG1655 genome showing positions of macrodomains (RIGHT, TER, LEFT, and ORI) and RNA polymerase (RNA-POL) binding (green peaks; ChIP-seq data from cells at mid-exponential growth phase [10]). E. coli flagellar genes are among the top 0.5% most highly expressed genes during exponential growth. The finding that the flagellar genes are among the top 0.5% of highly expressed genes in E. coli was derived from the RNA-Pol binding data obtained by Kahramanoglou et al [10]. Figure was generated by uploading the RNA-Pol binding data to the UCSC microbial genome browser for E. coli K12 MG1655 (http://microbes.ucsc.edu/cgi-bin/hgGateway?db=eschColi_K12).
