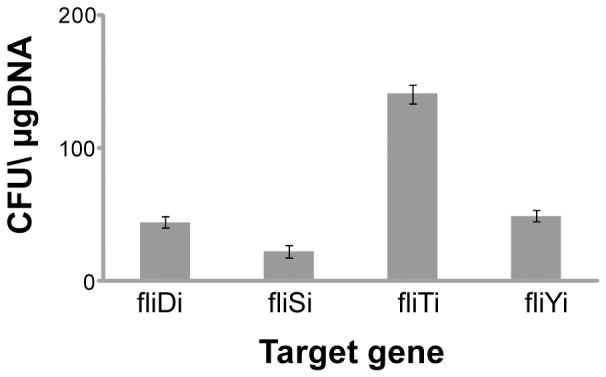
Figure 4. Variable efficiency of integration into flagellar genes.

Figure shows the numbers of colonies per µg of electroporated DNA with the DNA fragment integrated in fliD (fliDi), fliS (fliSi), fliY (fliYi), and fliT (fliTi) of the E. coli flagellar region. The bars and errors represent averages and standard deviation calculated from three independent replicates.
