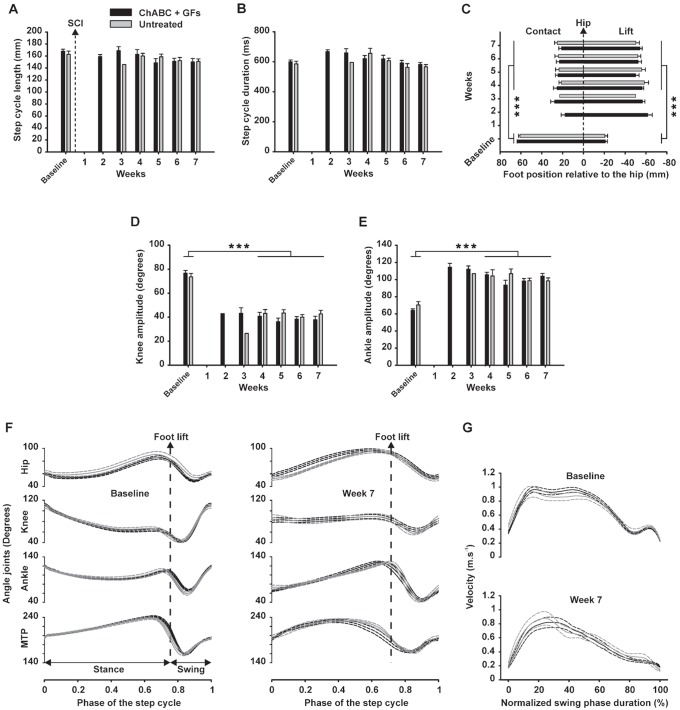
Figure 6. Kinematic analysis of locomotor patterns during the recovery period.
Kinematic data were gathered in two groups (i.e. ChABC+GFs and vehicle groups) and averaged before (baseline) and each week for 7 weeks after SCI. Because too few animals were capable to walk on treadmill during the three first weeks after SCI, statistical analysis were performed on baseline and week 4–7 only. (A) Mean length of the full step cycle (i.e. stance + swing phases) in millimeters is presented. (B) Mean duration of the full step cycle in milliseconds are shown. (C) Position of the foot contact (i.e. left part of the chart) and lift (i.e. right part) in millimeters relative to the vertical projection of the great trochanter are depicted (i.e. named hip in the chart and represented by the zero value). (D) Averaged amplitude of the knee joint in degrees and (E) averaged amplitude of ankle joint are presented. (F) Averaged angle excursions of the hip, knee, ankle and MTP, before (left panel) and 7 weeks after SCI (right panel) are shown. (G) Comparison of the averaged instant foot velocity (i.e. full lines) during swing phase before (top panel) and 7 weeks after SCI (bottom panel) for both groups, their respective SEM envelopes (i.e. dash line) are given. Symbol *** represent a significance threshold ≤0.001.

