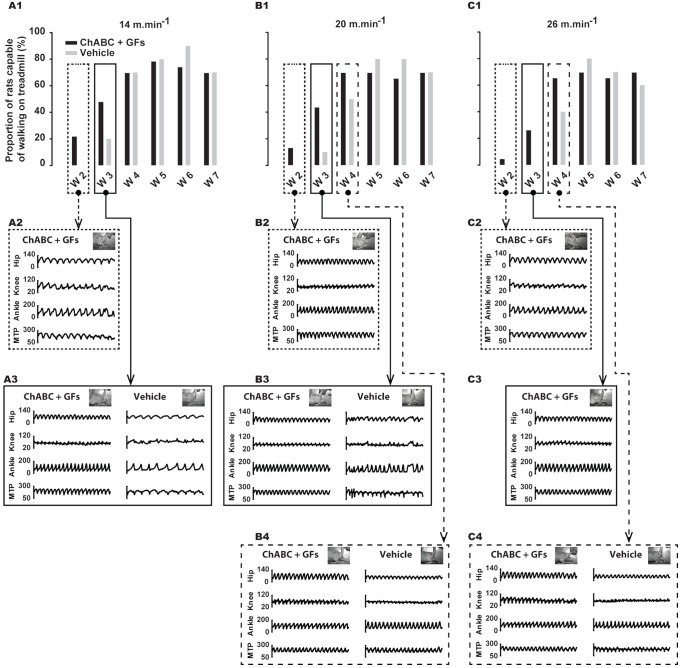
Figure 8. Frequency of rats that have recovered locomotion on treadmill at the three studied velocities and at the different time points throughout the recovery period.
(A1, B1 and C1), percent of rats capable of walking on treadmill at 14, 20 and 26 m.min−1 respectively, before and each week of the recovery period for ChABC+GFs and Vehicle groups. (A2 and A3), raw angular excursions of hip, knee, ankle and MTP joints extracted from representative rats walking at 14 m.min−1 at week 2 and 3 respectively. (B2, B3 and B4), raw angular excursions of hip, knee, ankle and MTP joints extracted from representative rats walking at 20 m.min−1 at week 2, 3 and 4 respectively. (C2, C3 and C4), similar to B2, B3 and B4 for 26 m.min−1. Data in A1, B1 and C1 are expressed in percentage of the group while the other panels below show angular data expressed in degrees.

