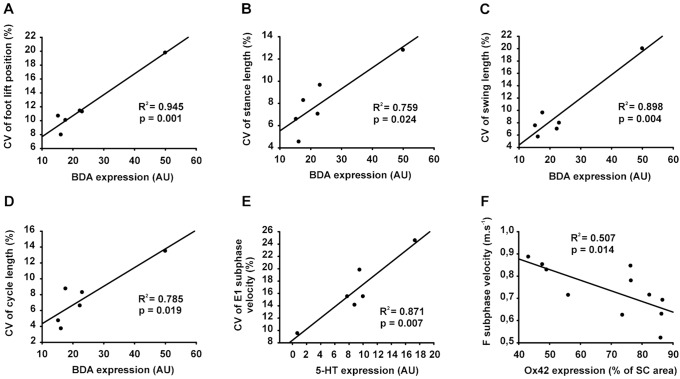
Figure 9. Relationships between behavior and neuroanatomical parameters.
Given the absence of significant difference between groups for the behavioral features, available data from all rats were plotted together regardless of the groups. Given that the tissue preparation was different from one labelling protocol to the other, some animals were blindly selected in each group for each different procedure. In addition, among these selected animals not all have recovered the locomotion 7 weeks after SCI (as shown in Fig. 9 A1, B1 and C1). Taken together, this double restriction explains the limited number of plotted data in the present figure. (A) Global expression of BDA labeling from the spinal cord section studied was plotted against the coefficient of variation (CV) of the foot position at the onset of the swing phase. (B) Graph depicts overall BDA expression against the CV of stance phase length. (C) Overall BDA expression against the CV of swing phase length is shown. (D) Overall BDA expression against the CV of the step cycle length is depicted. (E) Graph shows overall 5-HT expression plotted against the CV of E1 subphase (i.e. 2nd part of the swing phase: extension of the hindlimb before foot contact) velocity. (F) Overall Ox42 expression is shown against averaged velocity of the F subphase (i.e. 1st part of the swing phase: initial flexion of the hindlimb following the foot lift). BDA and 5-HT quantifications are expressed in arbitrary unit (AU), CV is expressed in percentage of the mean and Ox42 labeling is expressed in percentage of the total spinal cord (SC) area. The coefficient of determination (R2) and statistical significance (p) are given on each panel.

