Figure 2.

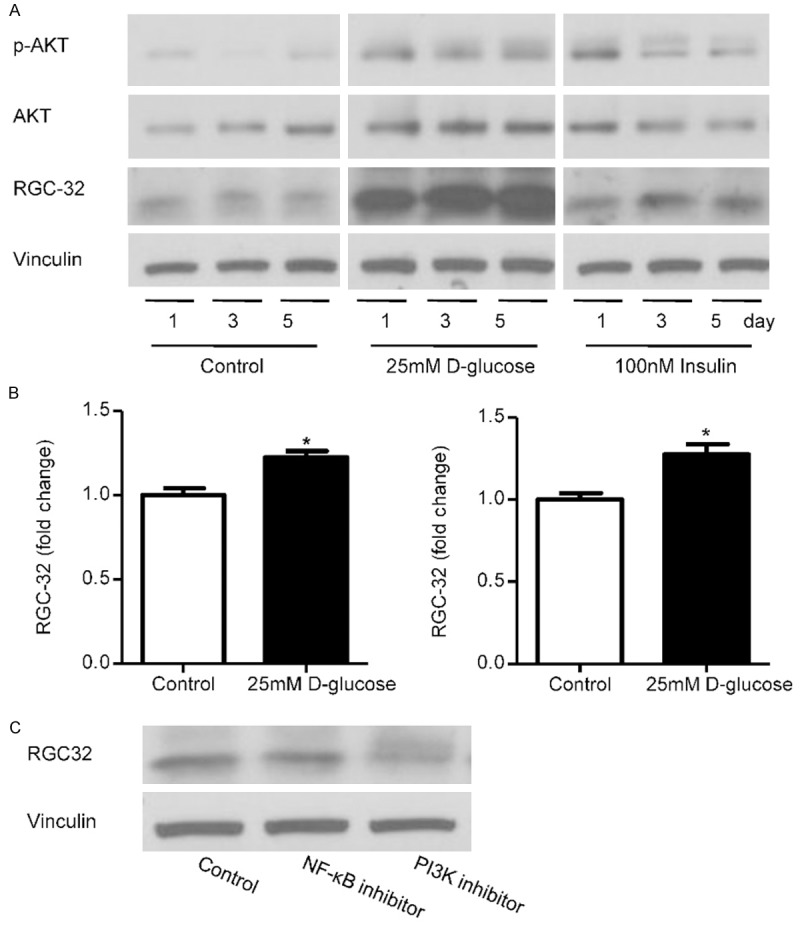
Effect of glucose and insulin in RGC-32 expression in HMEC-1. A. Immunoblot analysis of RGC-32, phosphate-AKT and AKT in HMEC-1 cells after 25 mM D-glucose or 100 nM insulin treated for 1, 3 or 5 days. Upper panel showed represent blot and the lower panel showed the result analyzed by Image J. B. Quantitative real-time polymerase chain reaction (QPCR) analysis of RGC-32 mRNA levels in human microvascular endothelial cells (HMEC-1) after 1 or 3 days treatment by 25 mM D-glucose. C. Immunoblot analysis of RGC-32 in HMEC-1 cells treated with selective PI3-K inhibitor LY294002 or IKK α/β inhibitor Wedelolactone. *P<0.05.
