Figure 1.

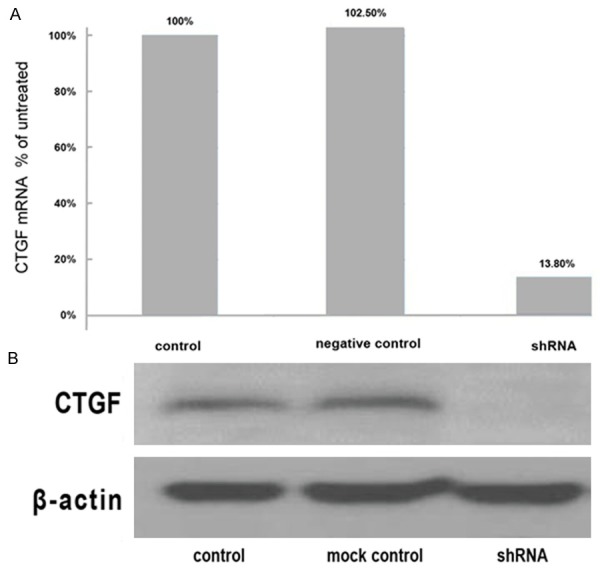
The expression levels of CTGF mRNA and protein. A. The mRNA expression of CTGF was significantly decreased in the shRNA group compared to the mock group (p < 0.05). No significant difference was observed between mock control and negative control. B. CTGF protein levels were determined by Western blotting. Weak expression of CTGF protein in shRNA group but strong expression in control and mock control group was shown.
