
Figure 2.
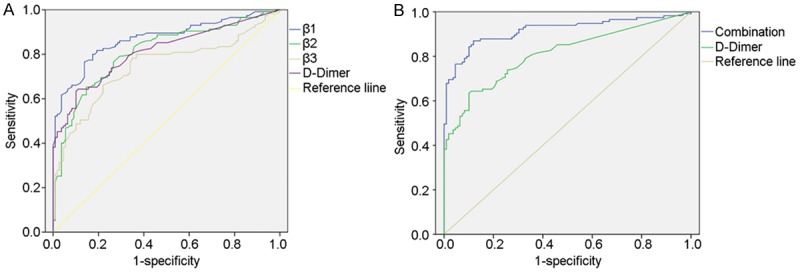
Receiver Operating Characteristic (ROC) curves for distinguishing VTE patients from non-VTE patients. The comparative ROC curves for all the three integrins (left), combination of three integrins (right) and D-Dimer are provided. The area under the curve (AUC) of integrin β1, integrin β2 and integrinβ3 was 0.869 (P=0.000, 95% CI: 0.821-0.916), 0.809 (P=0.000, 95% CI: 0.752-0.867) and 0.742 (P=0.000, 95% CI: 0.676-0.809), respectively, and that of combined three integrins and D-Dimer was 0.917 (P=0.000, 95% CI: 0.878-0.956), and 0.811 (P=0.000, 95% CI: 0.754-0.868), respectively.