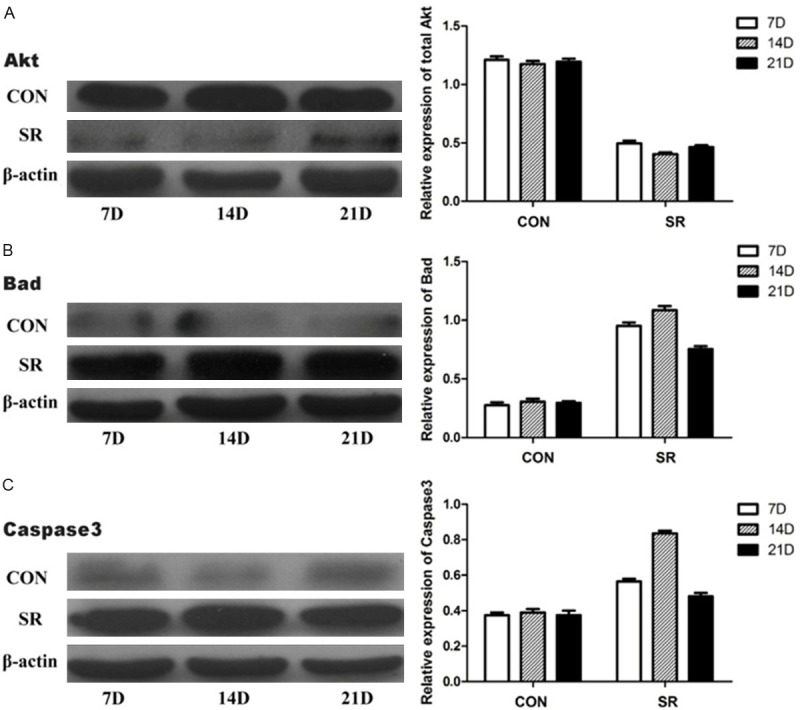
Figure 3.

Relative protein expression levels of total Akt, Bad and Caspase3. Relative protein expression levels of total Akt, Bad and Caspase3 in different groups. CON, caged controls; SR, sleep restriction group; and D, days. *P < 0.05, #P < 0.05, §P < 0.05, compared with the matching caged control group. Data are representative of three separate experiments performed in triplicates. Results are presented as the mean (SEM).
