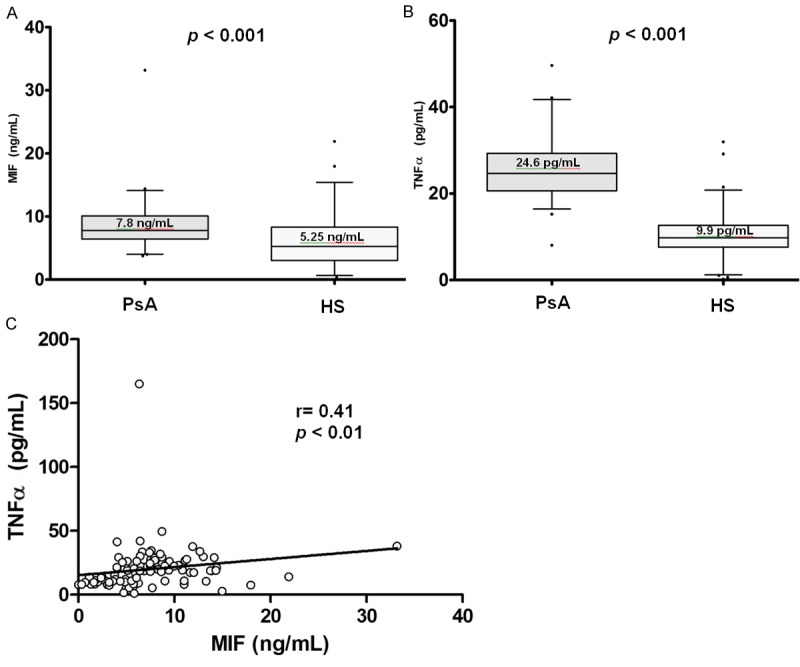
Figure 1.

Serum levels by study groups and correlation of MIF and TNFα. A. Comparison of MIF serum levels by study groups; B. Comparison of TNFα serum levels by study groups. Data provided in median (p25-p75). U Mann-Whitney test. C. Positive correlation of serum levels of MIF and soluble TNFα. Spearman’s correlation test.
