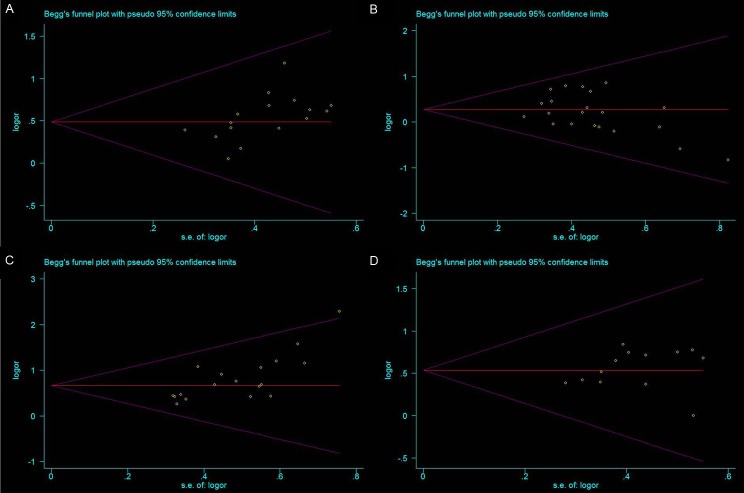
Figure 7.
A. Egger’s publication bias plot showed no publication bias for studies regarding overexpressed DcR3 and TNM stage in the meta-analysis; B. Egger’s publication bias plot showed no publication bias for studies regarding overexpressed DcR3 and differentiation in the meta-analysis; C. Egger’s publication bias plot showed no publication bias for studies regarding overexpressed DcR3 and lymph node metastasis in the meta-analysis; D. Egger’s publication bias plot showed no publication bias for studies regarding overexpressed DcR3 and infiltration degree in the meta-analysis.

