
Figure 1.
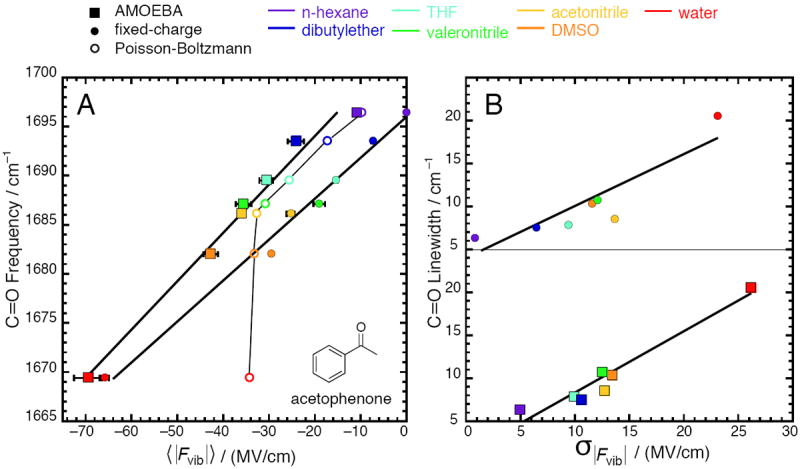
Correlation between calculated electric fields and properties of the C=O vibration on acetophenone for seven solvents (data given in Tables 1 and 2). Squares represent electric fields from simulations with the AMOEBA force field; closed circles represent electric fields from simulations with a fixed-charge force field23; open circles represent electric fields from solving the Poisson-Boltzmann equation. (A) Peak vibrational frequency correlates strongly with average electric field; (B) Full-width at halfmaximum (linewidth) correlates moderately with electric field standard deviation. In (A), the regression line is ν̄C=O = 0.484 〈|Fvib|〉 +1703.6 with R2 = 0.98 for AMOEBA, and ν̄C=O = 0.412 〈|Fvib|〉 + 1695.9 with R2 = 0.99 for fixed-charge. Estimates of the standard error for the slope and intercept are 0.0029 and 1.2 for AMOEBA, and 0.0020 and 0.6 for fixed-charge. For Poisson-Boltzmann, R2 = 0.6, and the trace is a guide to the eye, not a regression. In (B), the regression line is LWC=O = 0.714σ|Fvib| + 1.14 with R2 = 0.94 for AMOEBA, and LWC=O = 0.626σ|Fvib| + 3.46 with R2 = 0.8 for fixed-charge.