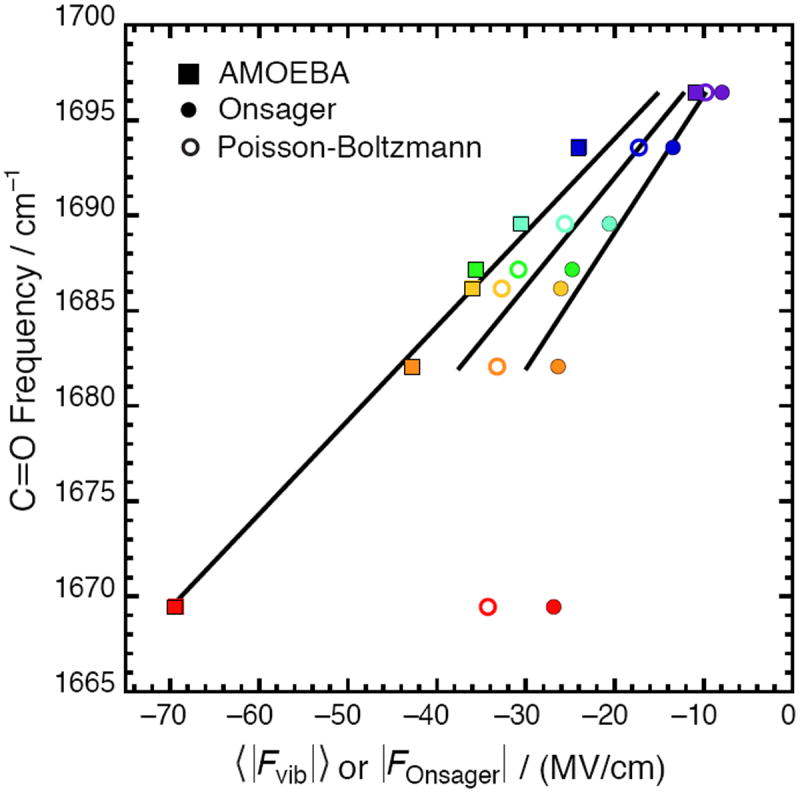
Figure 4.

Comparison between the average electric field predicted by AMOEBA, the Poisson-Boltzman equation, and the Onsager model for seven solvents (see Fig. 1 for color code). AMOEBA fields are reproduced from Figure 1 with error bars removed for clarity. The Onsager fields are calculated from Eq. 8 using μ0 = 2.95 D, n2 = 2.35, and a3 = 46.3 Å3. Excluding water, the regression line is ν̄C=O = 0.657|FOnsager| +1702.2 with R2 = 0.91 for Onsager and ν̄C=O = 0.526 〈|Fvib|〉 + 1702.2 with R2 = 0.92 for PB.
