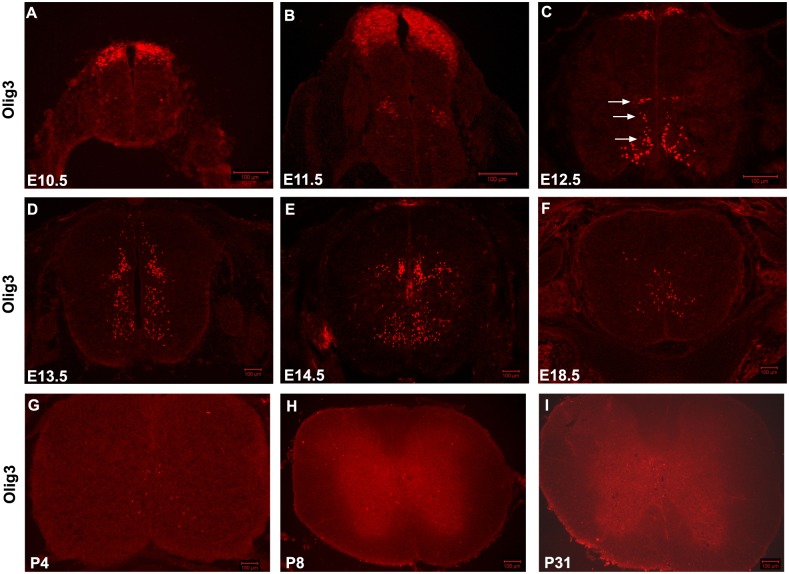
Figure 2. Olig3 expression pattern in the developing mouse spinal cord.
Cross sections from various embryonic mouse spinal cord tissues were subjected to immunofluorescent staining with rat anti-Olig3 antibody. (A) E10.5. (B) E11.5. (C) E12.5. (D) E13.5. (E) E14.5. (F) E18.5. (G) P4. (H) P8. (I) P31. Olig3 was initially expressed in the dorsal-most neuroepithelial cells at E10.5, and transiently expressed in three ventral groups at E12.5 (Shown by arrows). At E13.5, Olig3 was expressed in the lateral marginal zone of the entire spinal cord along dorsal-ventral axis. The expression pattern of Olig3 in the spinal cord is maintained from E14.5 to E18.5. Olig3 expression remained detectable at postnatal day 4 (P4) but not at P8 and later stages. The dorsal part is up. Bars, 100 µm.

