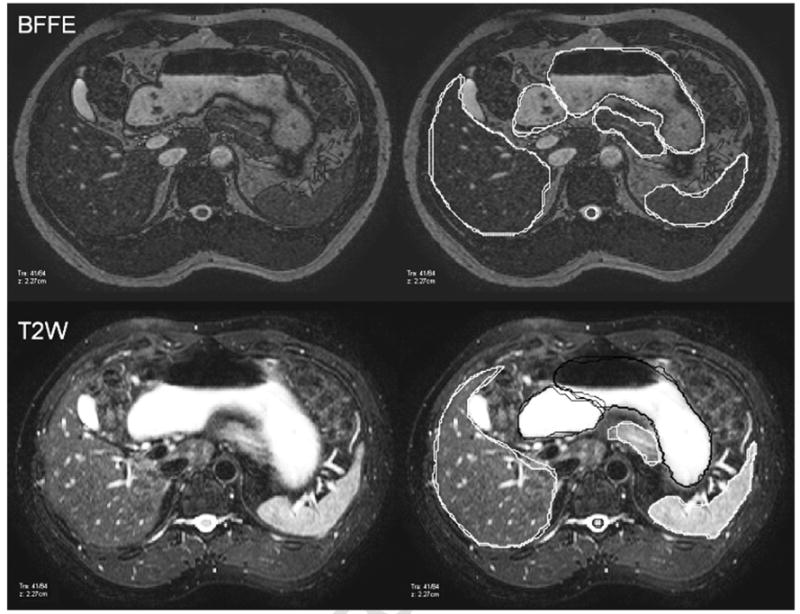
Fig. 3.

Images of a BFFE (top) and T2W (bottom) sequence for a single subject. Contours for 2 trials produced from a single observer are overlaid on the right-hand panel. Contours for the stomach, duodenum, and spinal cord produced from a single observer are displayed in black for the T2W sequence to enhance visualization.
