
Figure 1.
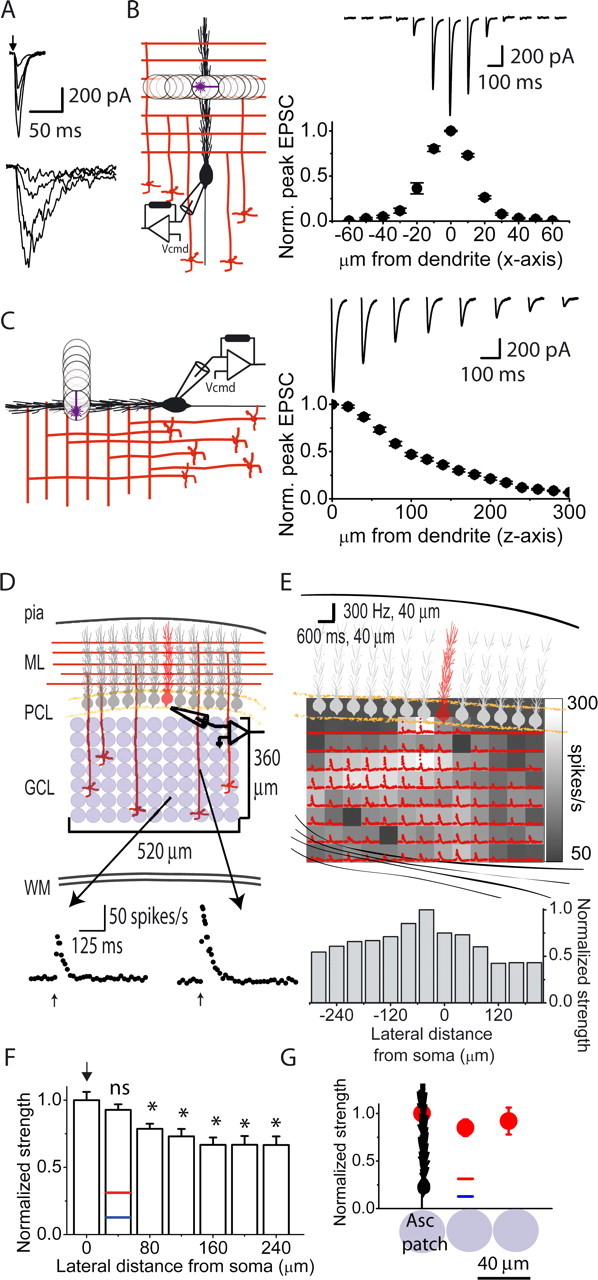
Mapping the efficacy of patches of granule cells in driving the firing of Purkinje cells. A, Glutamate-evoked currents were recorded in a voltage-clamped Purkinje cell (−60 mV) in response to photolysis of glutamate over its dendritic tree in the molecular layer (top) and in the granule cell layer beneath its soma (bottom). The kinetics of the currents resulting from photorelease of glutamate in the granule cell layer were much slower and the noise of the currents was much greater than that observed when glutamate was photoreleased directly over the dendrites of the target Purkinje cell. B, To examine the spatial selectivity of the 40 μm spot used for photolysis of glutamate in the X–Y plane, the dendrites of voltage-clamped Purkinje cells in acutely prepared coronal slices of the cerebellum were used as glutamate detectors. Using the same intensity pulse of UV light, glutamate was photoreleased at various lateral distances from the center of the dendritic tree of a voltage-clamped Purkinje cell, and the resulting currents were recorded. The photolysis spot was moved laterally in 10 μm increments in both directions. Sample glutamate-evoked currents recorded from a single Purkinje cell in response to glutamate photolysis at various lateral distances from the center of its dendritic tree are shown together with an average plot of peak EPSC amplitude as a function of photolysis location (n = 3 cells). Each raw data trace is the average of five trials. C, Experiments were performed to measure the depth of photolysis in the Z plane. Purkinje cells on the surface of sagittal cerebellar slices were voltage clamped and the intensity of the 40 μm spot of UV light was adjusted to produce a large-amplitude inward current when positioned on the surface of the slice within dendritic tree of the target Purkinje cell (0 μm from dendrite). The plane of focus was then moved vertically above the slice in 20 μm increments and the resulting currents in response to the same pulse of UV light at each location recorded. Sample glutamate- evoked currents recorded from a single Purkinje cell in response to glutamate photolysis at various vertical distances from its dendritic tree are shown together with an average plot of peak EPSC amplitude as a function of vertical distance from the Purkinje cell dendrite (n = 4 cells). Each raw data trace is the average of five trials. D, Glutamate photoreleased by a constant-intensity UV pulse activated patches of granule cells and the firing of a single Purkinje cell in a coronal cerebellar slice was monitored with extracellular recordings. Lower traces show instantaneous firing rate in response to photolysis of glutamate using the same intensity pulse of UV light at two separate locations. ML, Molecular layer; PCL, Purkinje cell layer; GCL, granule cell layer; WM, white matter. E, Top, Schematic drawing of the cerebellar slice and the Purkinje cell whose activity was recorded (shown in red). The grayscale map shows the maximum poststimulus instantaneous firing rate of the target Purkinje cell after photolysis of glutamate at each location. The instantaneous firing rate response at each location is superimposed on each location. The baseline firing rate of this Purkinje cell was 50 spikes/s. Bottom, The instantaneous maximum firing rates obtained from photolysis at each location within a column were averaged and these column strengths were then normalized to the strongest column value. F, The normalized column strengths obtained from eight maps were averaged based on lateral distances from the soma of the target Purkinje cell and renormalized to the strongest column value. Normalized strengths predicted for patches of granule cells making only parallel fiber inputs based on various estimates of granule cell connection probability and EPSC amplitudes are also shown as blue and red bars (see Results for details). Results are shown as mean ± SEM for these and all subsequent figures. * denotes statistical significance with respect to the column denoted by the arrow at p < 0.01. G, For all eight experiments included in F above, two investigators independently determined the location of the “ascending” patch in the row closest to the Purkinje cell layer. The average maximum instantaneous firing rate at the location that corresponded to the position where granule cells form ascending inputs (Asc patch) was taken as one. The relative firing rates of the adjoining patches located on either side of the ascending patch and the second adjacent pair located 80 μm away from the ascending patch were pooled and averaged. Data are presented as mean ± SEM.