
Figure 2.
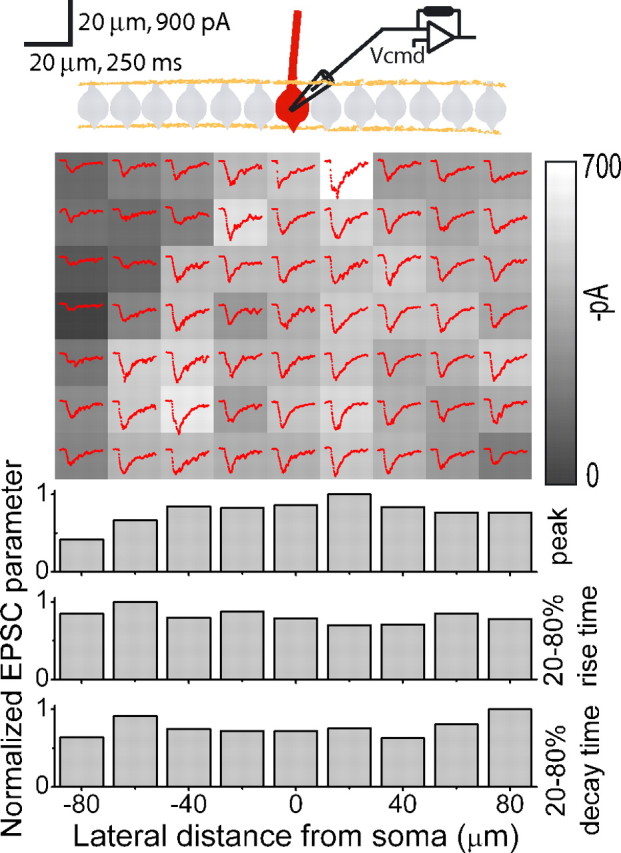
High-resolution EPSC maps in juvenile rats. Top, A sample experiment in which EPSCs were monitored in a whole-cell voltage-clamped Purkinje cell in response to glutamate photorelease as in Figure 1E. In these experiments the spot was moved in 20 μm increments to improve mapping resolution. Inclusion of 100 μm Alexa Fluor 488 in the patch-pipette solution allowed determination of the exact orientation of the dendritic plane of the voltage-clamped Purkinje cells (red). The grayscale patches show the average magnitude of peak EPSC amplitudes resulting from glutamate photolysis at each location. The average of three EPSCs (red traces) is also shown for each position. Bottom, EPSC peak amplitudes, 20–80% rise times, and 20–80% decay times from every position in a column were averaged and normalized to the largest column value.