
Figure 4.
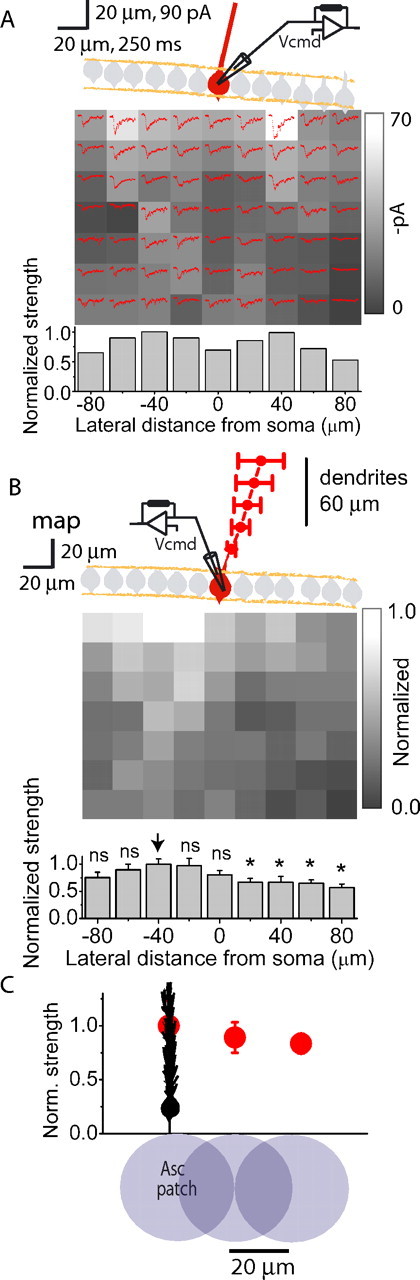
Adult maps also do not show powerful ascending granule cell patches. A, A single EPSC mapping experiment as shown in Figure 2 except in a slice obtained from an adult rat (2–3 months old). The dendritic plane of the voltage-clamped Purkinje cell is shown in red. The grayscale map shows the average magnitude of peak EPSC amplitudes resulting from glutamate photolysis at each location. Average of three EPSCs (red traces) is also shown for each position. Bottom, Peak EPSC amplitudes from every position in a column were averaged and normalized to the largest column value. B, Top, Average normalized EPSC map and dendritic orientation (red) obtained from five Purkinje cells in slices from adult rats. Bottom, A column-by-column analysis of the average normalized EPSC map shown above. Peak EPSC amplitudes from every position in a column were averaged and normalized to the largest column value. * denotes statistical significance with respect to the column denoted by the arrow at p < 0.05. C, Same as Figure 3D except from experiments performed in slices obtained from adult rats.