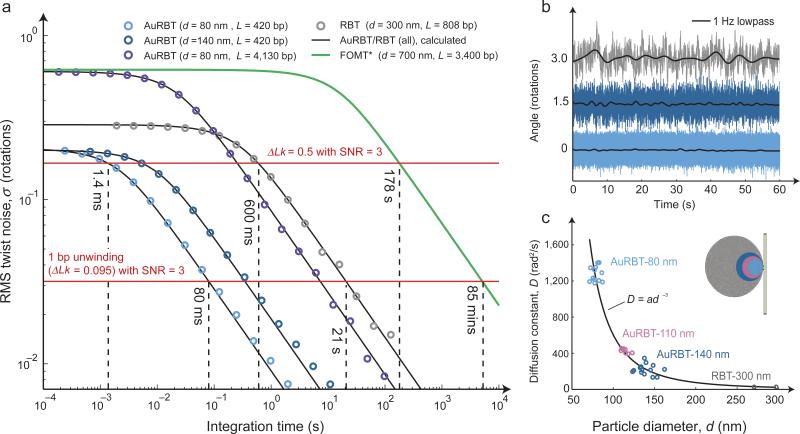
Figure 2. Angular resolution of AuRBT.
(a) Reduction of Brownian twist noise as a function of integration time. Data points for the indicated probe sizes and tether lengths were obtained by computing the angular standard deviation across time-averaged data bins of varying sizes. Model curves were computed from Equation 1 using the torsional stiffness κ and relaxation time τ, obtained from separate fits to noise power spectral density plots (Supplementary Fig. 4 and Supplementary Table 1). Dashed lines illustrate the integration times required to achieve an SNR value of 3 for the indicated signal sizes (SNR = 3 is chosen as an example; different SNR values may be desired, depending on the application). Plots were generated using raw data traces sampled for 63 s (AuRBT-80nm/420bp), 350 s (AuRBT-140nm/420bp), 785 s (AuRBT-80nm/4130bp), and 505 s (RBT-300nm/808bp). *The theoretical FOMT curve is calculated from the most favorable parameters reported in reference 13. (b) Full-bandwidth (color) and lowpass filtered (black) angle traces for various probe and tether combinations. Light blue: 80 nm probe / 420 bp tether, dark blue: 140 nm / 420 bp, gray: 300 nm / 808 bp. (c) Cubic scaling of rotational drag. For 36 different rotor beads, rotational diffusion constants D were measured by analyzing noise power spectra (as in Supplementary Fig. 4) and orbital diameters d were fit to the annulus of 2D positions (as in Fig. 1b). A plot of D vs d was fit to a cubic function: D = ad3; small deviations from this model are expected to occur due to surface proximity (Supplementary Fig. 5).

