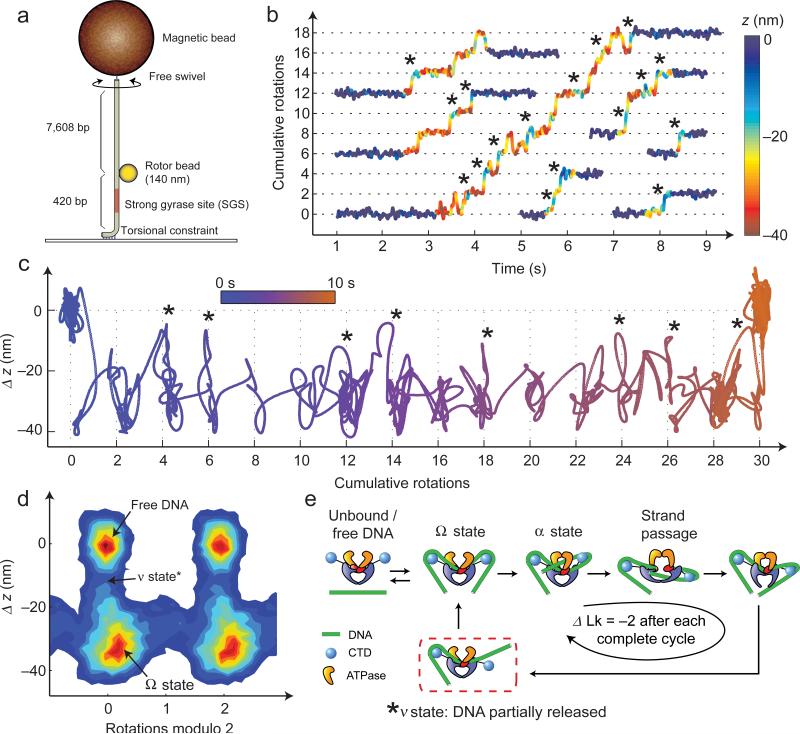
Figure 4. High-resolution analysis of gyrase dynamics at 1 mM [ATP].
(a) “Bottom-constrained” experimental geometry. During gyrase activity, the angle and height of the bead reflect changes in Lk and extension of the lower DNA segment3,6. Measurements were performed using 140 nm rotors under 1.1 pN of tension, and angle and z were both lowpass filtered to 50 Hz. (b) Excised traces of single-enzyme bursts. Angle is plotted as a function of time, with color (blue to red) indicating the instantaneous value of DNA extension. Dominant dwells are visible every two rotations as expected6. Short regions flanking each burst show the extension of free DNA. Asterisks mark events in which the DNA extension briefly increases, primarily coinciding with entrance into a new rotational dwell. (c) A single gyrase trace is shown projected along angle and z-axes; brief excursions (*) are visible between dominant dwells. Color represents time, progressing from blue to orange. (d) 2D histogram of angle and z coordinates6 accumulated over a total of 97 gyrase cycles belonging to 19 enzymatic bursts on five separate DNA tethers; 1.5 s of data flanking each burst were included to show the position of free DNA. (e) Proposed model explaining excursions in extension (*). DNA contour length is released from one or both CTDs after strand passage, entering a newly defined ν state. The DNA is then recaptured to reset the enzyme for the next cycle.

