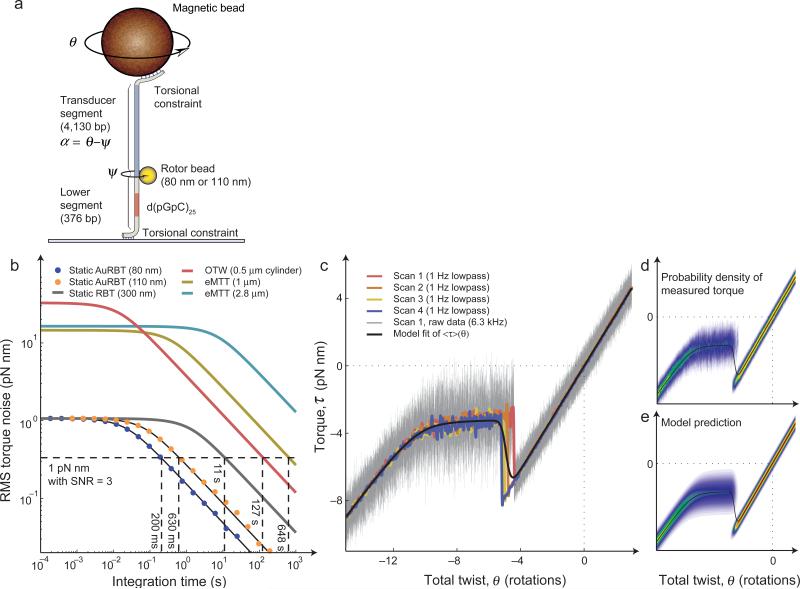
Figure 5. AuRBT torque spectroscopy.
(a) “Doubly-constrained” experimental geometry for static torque measurements3,23,26. Total twist θ can be varied by rotating the magnets, and torque is measured from the angular deflection of a calibrated transducer segment, τ = κα. A sequence of interest (SOI) can be placed in the lower segment, such as the 50 bp GC repeat used here to examine Z-DNA formation. (b) Torque resolution of AuRBT and of published alternative methods for measuring DNA torque. RMS torque noise was measured as a function of integration time, using 4130 bp transducer segments assayed in a “top-constrained” geometry. (The 80 nm rotor results are plotted from the same dataset as AuRBT-80nm/4,130bp in Figure 2a.) Corresponding power spectral density plots are shown in Supplementary Figure 6. Models (Equation 3) were parameterized from spectral analysis for AuRBT and RBT and based on reported parameters for eMTT21, and OTW50. The dashed horizontal line indicates the RMS torque noise required for measuring a 1 pN nm change with a signal-to-noise ratio of three, and its intersection point with each curve indicates the necessary duration of signal averaging. (c) Torque as a function of imposed twist for a DNA molecule containing a 50 bp GC-repeat. (Similar traces were obtained for a total of four molecules under two buffer conditions.) AuRBT-110 was used under 5 pN of tension, and twist was ramped linearly at 0.05 rotations/s. Lowpass filtered data for four individual rewinding curves on the same molecule are shown as colored traces, and full-bandwidth data (6.3 kHz) are shown in gray. A statistical mechanical model for the B-Z transition23,26 was used to fit <τ>(θ) to the collection of four curves (J = 4.55 kcal/mol, ΔG = 0.47 kcal/(mol bp), 1/κo = 4.07 rad/(pN nm), Δct = 0.015 rad/(pN nm bp), and Δθ = -1.03 rad/bp). (d-e) Distributions of measured torque as a function of imposed twist (see also Supplementary Video 2). The expectation torque curve from (c) is replotted in black. (d) The combined full-bandwidth data from all traces in (c) were binned in order to plot P(τ) (heat-mapped) for each value of twist. (e) The predicted P(τ) was calculated (equations S9-S12) based on the parameters determined from fitting the expectation torque curve, and plotted for comparison with experiment.

