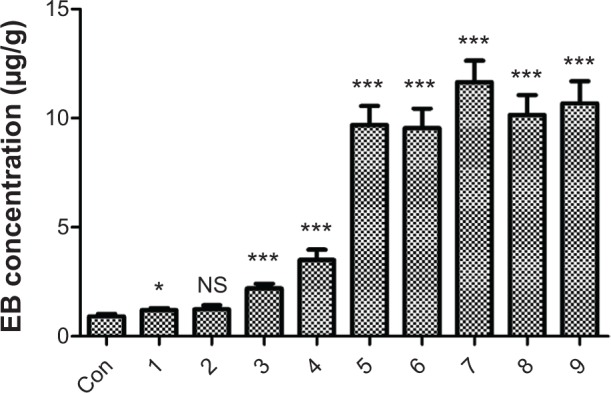
Figure 6.

EB extravasation into the rat brain following the treatments shown in Table 1.
Notes: EB was extracted from the brain tissues and determined by absorbance at 620 nm. The rats in the control group received the EB injection only. Data are presented as the mean ± standard deviation (n=10). *P<0.05 versus control; ***P<0.001 versus control; NS, P>0.05 versus control.
Abbreviations: Con, control; EB, Evans blue.
