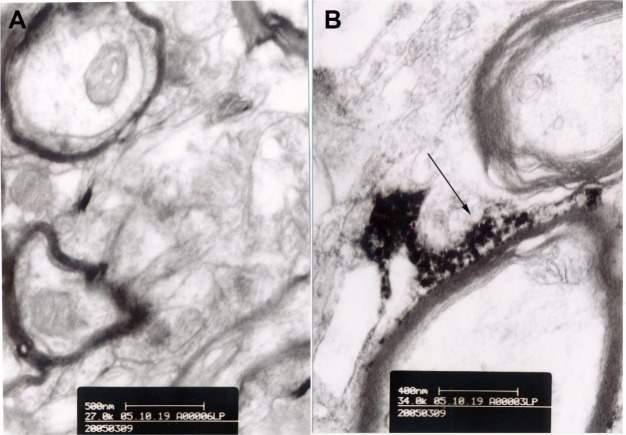
Figure 9.
Transmission electron microscopic images of lanthanum nitrate-perfused rat brain.
Notes: (A) Control rats; bar 500 nm. (B) Rats treated with methotrexate-liposome-coupled microbubbles and ultrasound showing lanthanum deposition outside the basement membrane of the vascular wall. The arrow shows lanthanum deposition between the nerve fibers; bar 400 nm.

