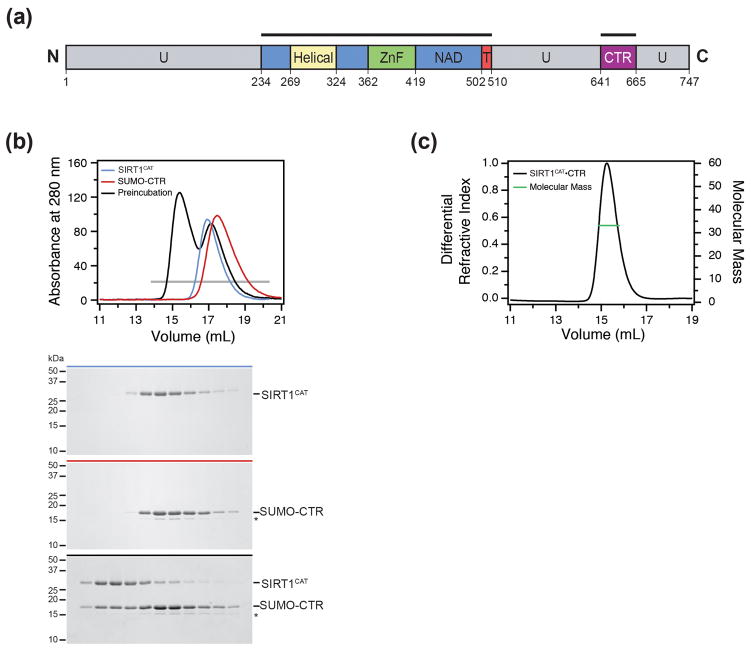
Fig. 1.
Biochemical analysis of the SIRT1CAT•CTR complex. (a) Domain structure. Blue, NAD+-binding domain; yellow, helical module; green, Zn2+-binding module; red, pseudo-substrate peptide (T, tail); purple, C-terminal regulatory segment (CTR); grey, predicted unstructured regions (U). The bars above the domain structure mark the crystallized fragments. (b) Size-exclusion chromatography interaction analysis of SIRT1CAT with SUMO-CTR. The analyzed proteins and complexes are indicated in each gel filtration profile. For analysis of complex formation, the SUMO-CTR was mixed at approximately 2-fold molar excess of SIRT1CAT and injected onto a Superdex 200 10/300 GL gel filtration column. Gray bars and colored lines designate the analyzed fractions. Molecular mass standards and the positions of the proteins are indicated. The asterisk indicates a degraded SUMO-CTR fragment. (c) Multiangle light scattering (MALS) analysis of the SIRT1CAT•CTR heterodimer. The differential refractive index is plotted against the elution volume from a Superdex 200 10/300 GL gel filtration column and overlaid with the determined molecular mass for the peak.

