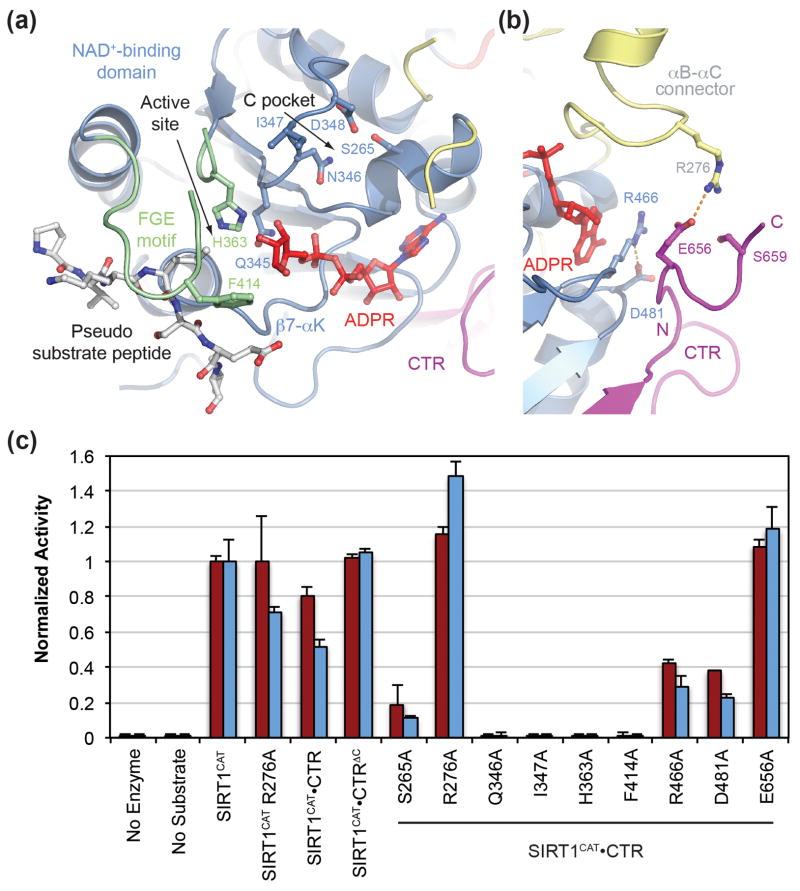
Fig. 6.
Mutational analysis. (a) Ribbon representation of the SIRT1CAT•CTR•ADPR•Substrate complex, with a stick representation of all mutated active side residues. The Zn2+-binding and helical modules were removed for clarity. (b) Ribbon representation of the SIRT1CAT•CTR•ADPR•Substrate complex, with a stick representation of all mutated SIRT1CAT-CTR interface residues. (c) Deacetylase activity of SIRT1 proteins and mutants towards modified p53-based peptides. Activity was determined in a luminescence (red) or fluorescence (blue) based assay and normalized against wild-type SIRT1CAT activity. Each data point represents the mean of at least three independent measurements. Error bars represent standard deviations. See also Fig. S5.

