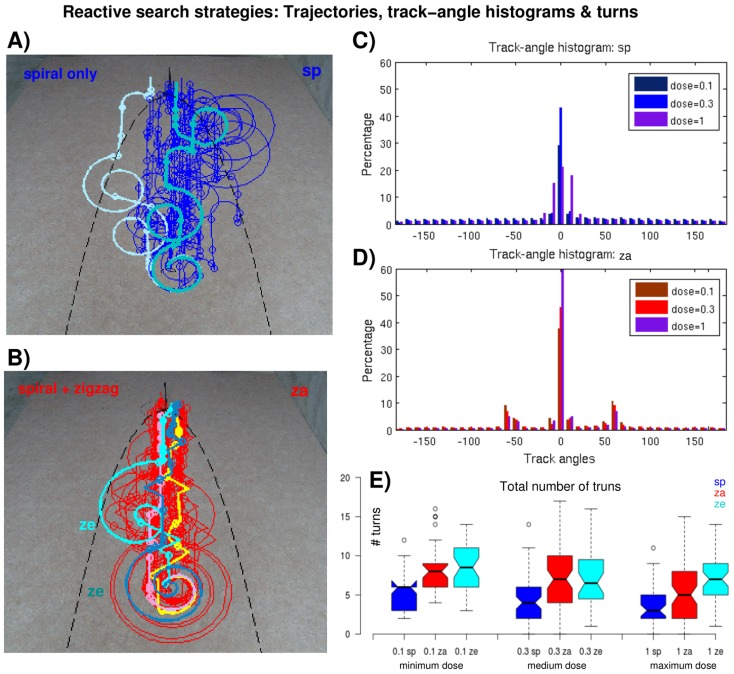
Figure 4. Reactive search trajectories.
(A) Examples of sp search trajectories (spirals only, i.e., no Off), medium dose. For a better visualization single paths are plotted in distinct colors (cyan and light blue on top of mostly blue trajectories). The dots on the trajectories indicate pheromone detections. The black dashed line indicates the plume contour (see Methods). (B) Examples of search trajectories including Off zigzagging, medium dose. Red, yellow and pink trajectories use arithmetic spirals (za), bluish trajectories originate from assuming exponential spirals (ze). Identical conventions as in (A). (C and D) Track-angle histogram of sp and za trajectories, respectively, different colors indicate different pheromone doses. (E) Total number of turns for different stimulations, different colors indicate different reactive strategies for the three groups of pheromone doses, identical conventions as in Fig. 3.

