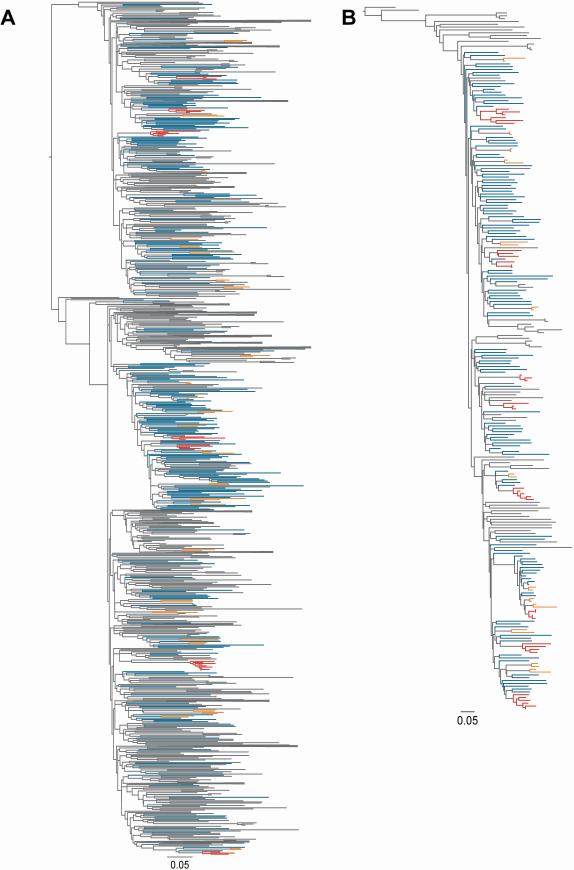
Figure 2. Phylogenetic tree of HCV a) genotype 1a and b) genotype 3a in the VIDUS cohort, 1996-2012, Vancouver, Canada.
The maximum likelihood tree was inferred using RAxML, and participants in pairs (n=2, orange) and clusters (n>2, red) differentiated from non-clustered participants (blue) and Los Alamos National Laboratory reference sequences (grey) using ClusterPicker with a bootstrap threshold of 90% and a genetic distance of 0.05. Large clades containing only reference sequences were collapsed.

