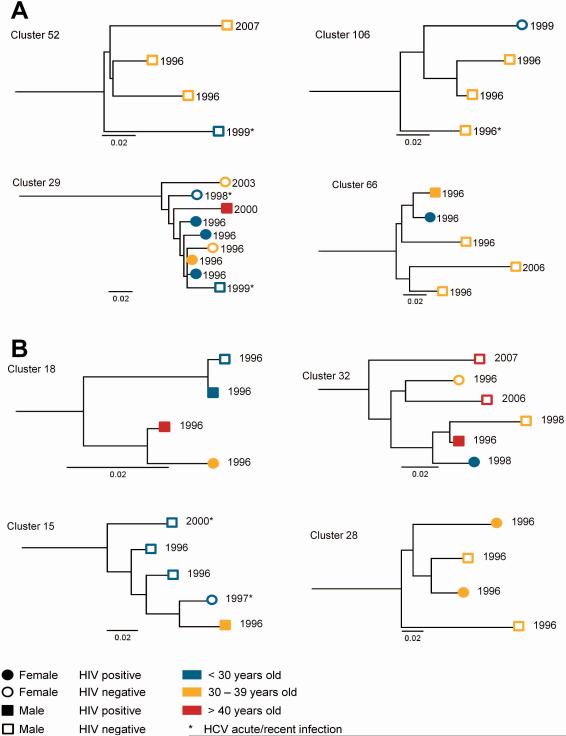
Figure 4. Example sections of maximum-likelihood phylogenetic tree showing clusters with greater than or equal to four participants for a) genotype 1a and b) genotype 3a.
Participants in pairs (n=2) and clusters (n>2) identified using ClusterPicker with a bootstrap threshold of 90% and a genetic distance of 0.05. Numbers at tips represent date of sequencing.

