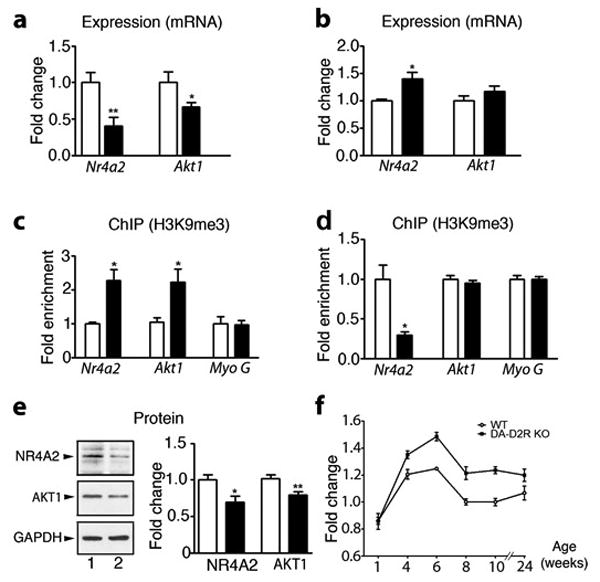
Figure 3. Silencing of Nr4A2 and Akt1 genes in the PFC of DA-D2RKO mice is associated with H3K9me3.

(a-f) WT: white bars; DA-D2RKO: black bars. Values are means ± SEM. (a) qRT-PCR of Nr4a2 and Akt1 mRNA expression in the PFC and (b) striatum (n= 4WT/6DA-D2RKO/area) (WT value set as 1). (Student's t test:*p < 0.05, **p<0.01). (c) Quantitative H3K9me3 ChIP on Nr4a2 (n=4/genotype ), Akt1 (n=3/genotype) and Myoglobin G promoters in PFC and (d) striatum extracts. (Student's t test; *p < 0.05) (e) Western-blot analyses (left) and quantifications (right) of NR4A2 (n=4WT/5DA-D2RKO), AKT 1 (n=6WT/7DA-D2RKO) and GAPDH protein levels in WT (lane 1) and DA-D2RKO mice (lane 2) expressed as fold changes from WT. (Student's t test: *p < 0.05, **p < 0.01). (f) Quantification of H3K9me3 immunostaining of sections from WT and DA-D2RKO PFCs during post-natal life, as indicated. A significant genotype x age interaction is noted (F (5,30)=2.48 p=0.0337) (n=3 mice/genotype).
