Figure 1.
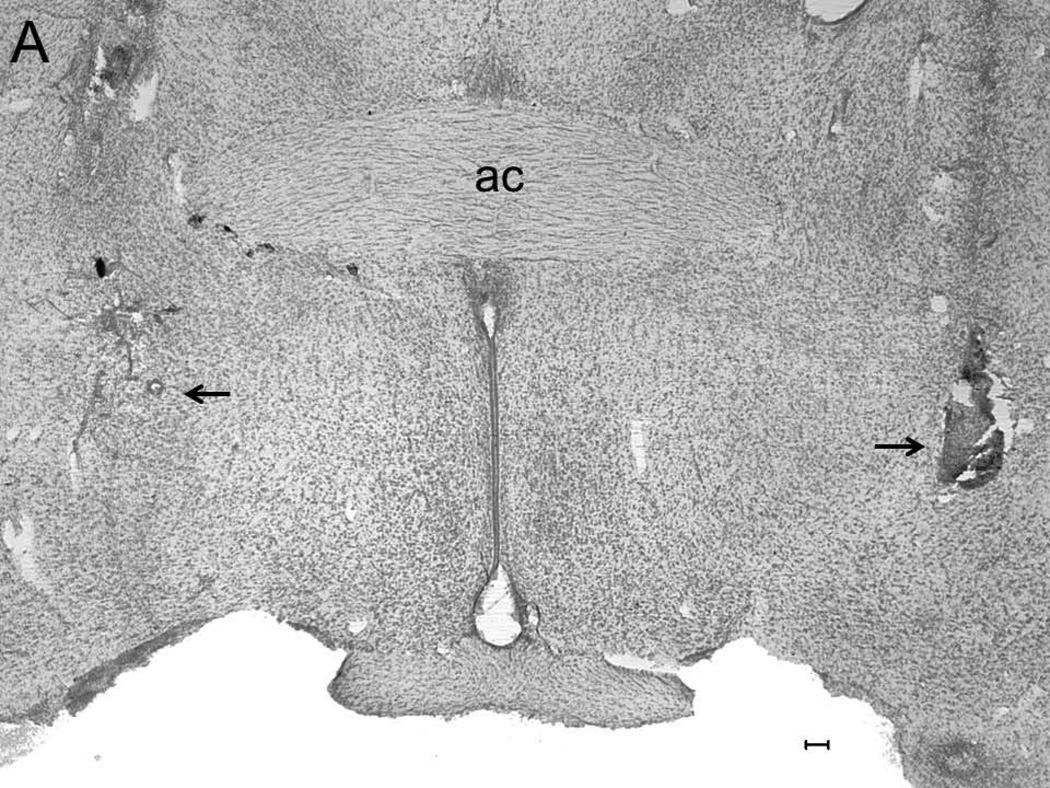
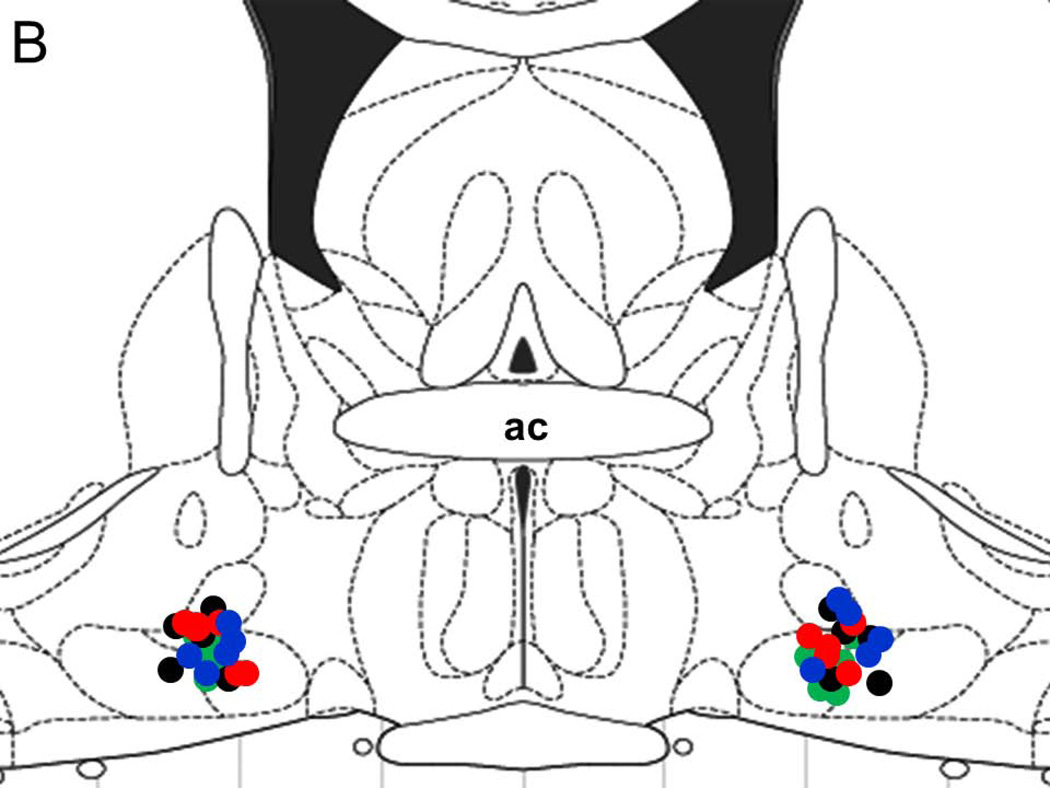
A representative photomicrograph depicting lesions (arrows) caused due to bilateral microinjections in the basal forebrain (BF). Abbreviations: ac, anterior commissure; Calibration bar: 100 µm (Panel A). All injection sites were localized in the BF and a schematic representation of all injection sites (N=20; 5/group) mapped on one coronal schematic (AP = −0.3; adapted from Paxinos and Watson 2007) is described in Panel B. Circles denote injection sites. Blue circle = ACSF infusion in ACSF+W group; Black circle = ACSF infusion in EtOH group; Green circle = nicotine infusion in NiC group and Red circle = nicotine infusion in NiC+EtOH group.


