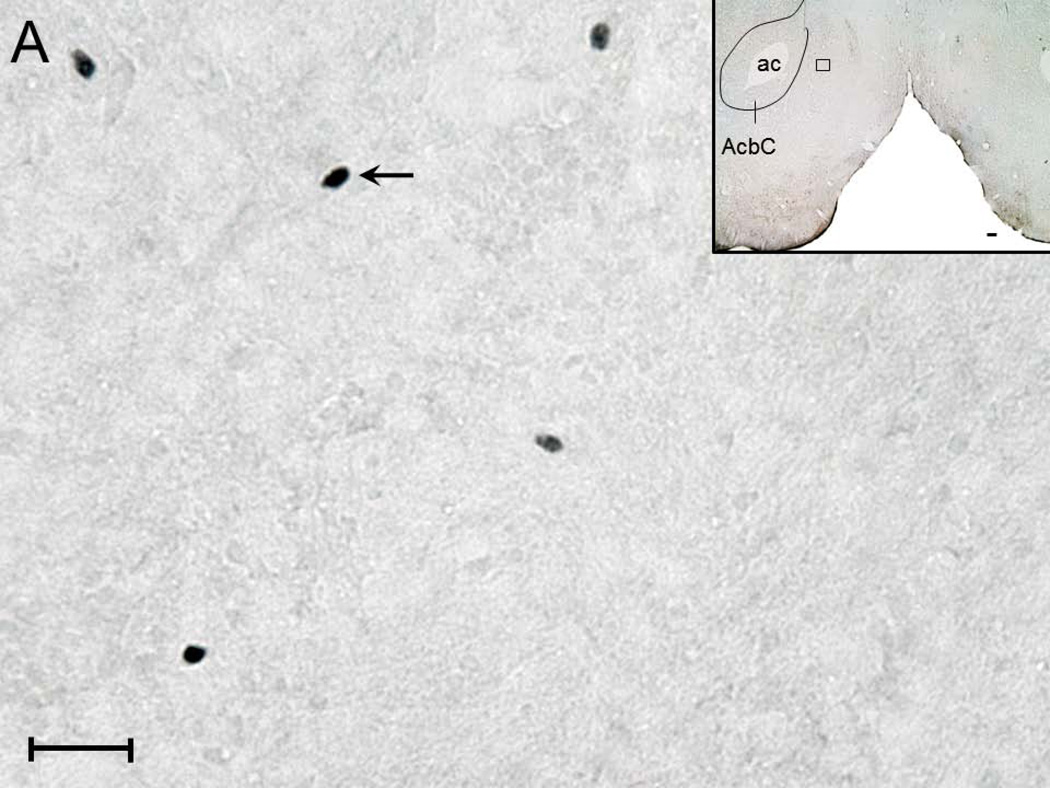
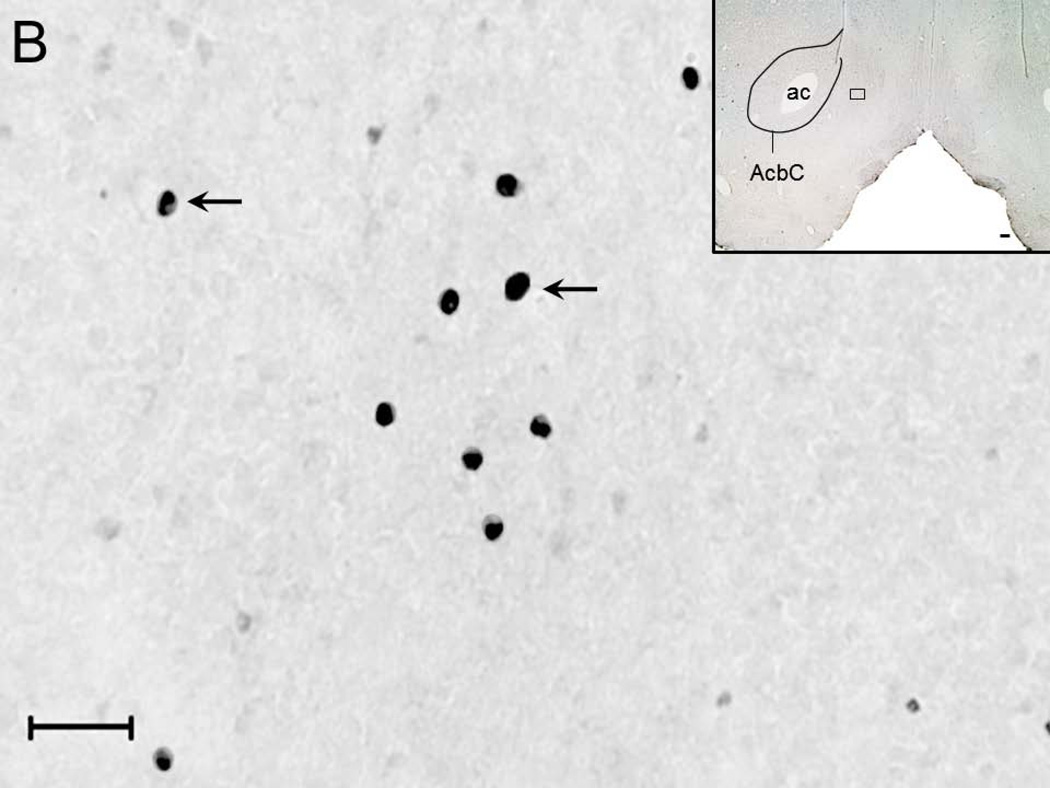
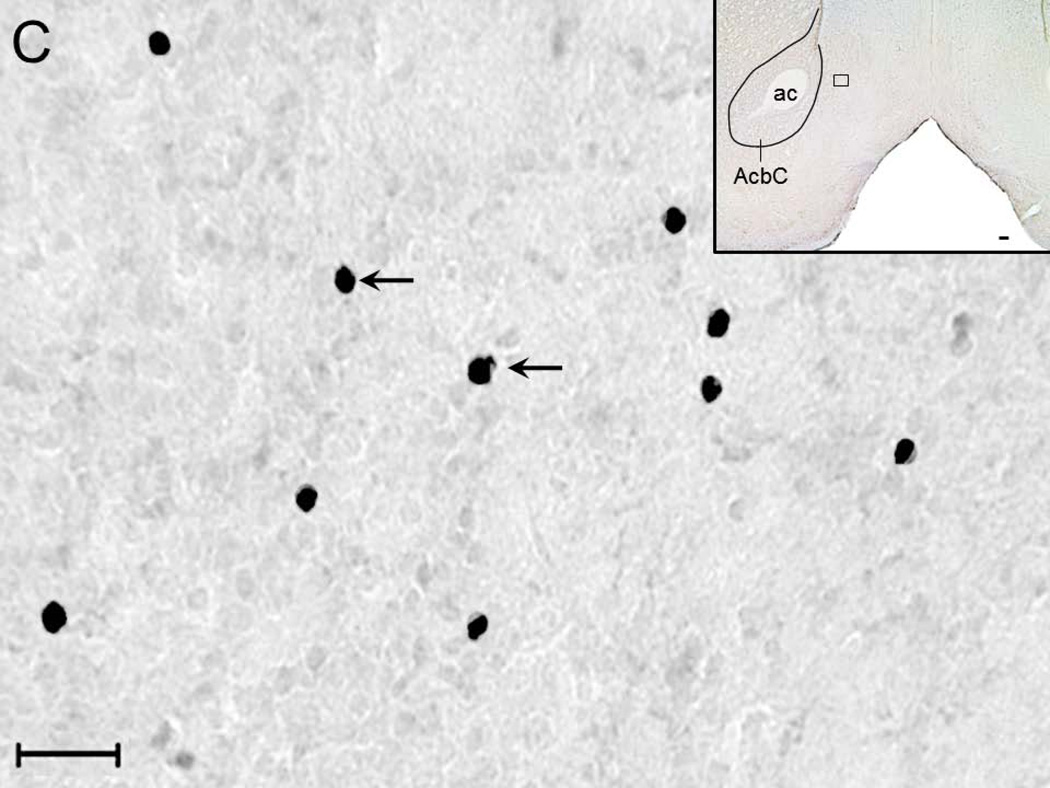
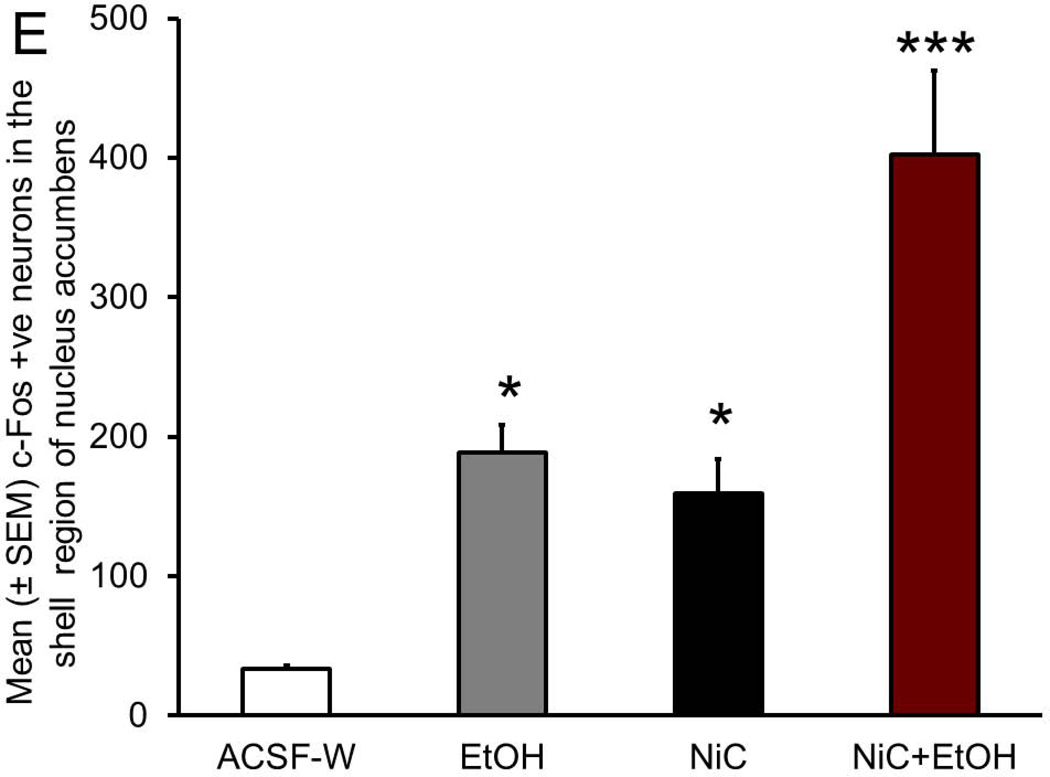
Figure 2.
Representative high magnification photomicrograph depicting c-Fos +ve nuclei (arrows) in the NAc shell region of rats exposed to: systemic water + BF ACSF administration (Panel A); systemic alcohol + BF ACSF administration (Panel B); systemic water + BF nicotine administration (Panel C) and systemic alcohol + BF nicotine administration (Panel D). Calibration bar: 30 µm. The boxes in the insets describe the localization of the photomicrograph in the NAc shell. Calibration bar: 100 µm. Abbreviations: ac, anterior commissure; AcbC, core region of NAc. The graphical representation of the results is described in Panel E.


