Fig. 4.
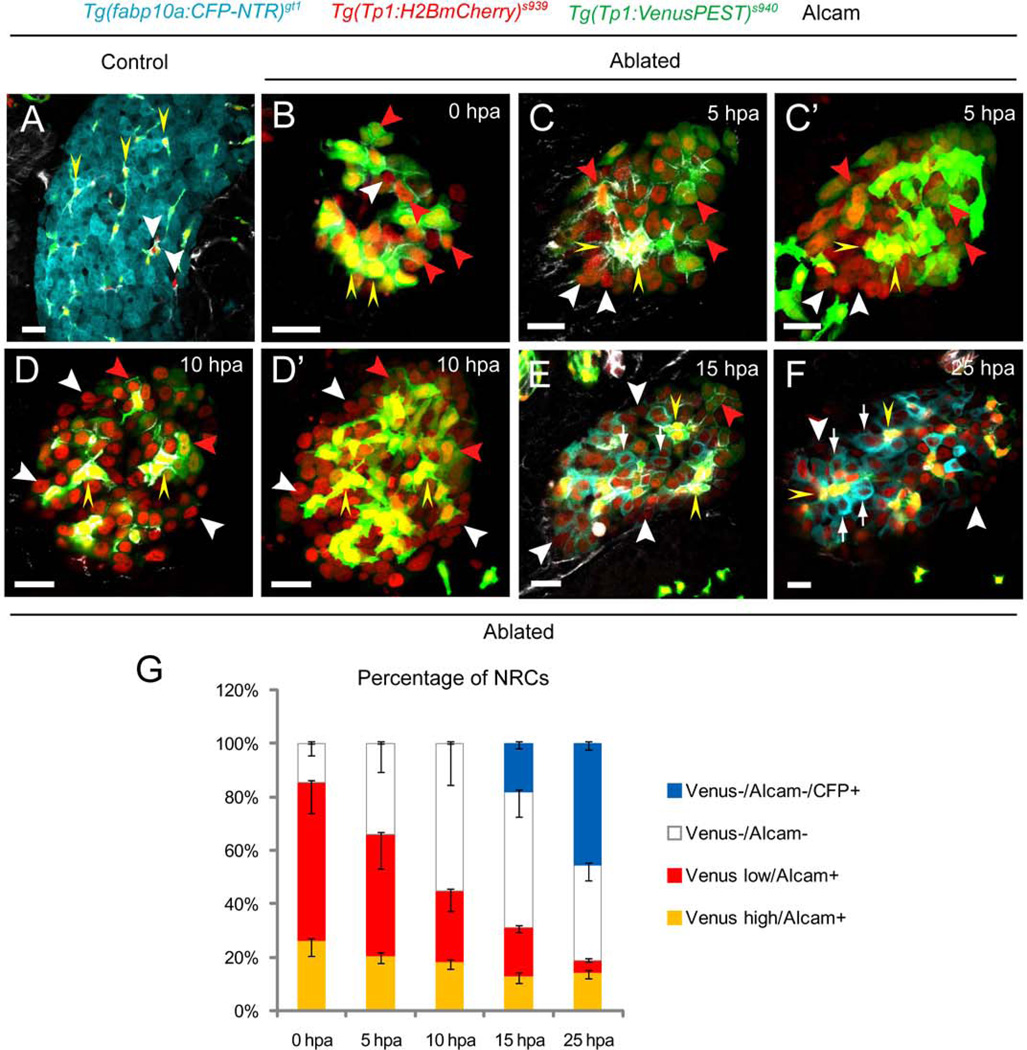
Distinct levels of Notch signaling are essential for the differentiation of the HPCs into hepatocytes. (A) In [Tg(fabp10a:CFP-NTR)gt1; Tg(Tp:H2BmCherry)s939; Tg(Tp1:VenusPEST)s940] larvae treated with DMSO at 5 dpf, expression of Tg(Tp1:H2BmCherry) largely overlapped with that of Tg(Tp1:VenusPEST) (yellow arrowheads). A few Tg(Tp1:H2BmCherry)-single positive cells were observed (white arrowheads). (B–F) MTZ-treated larvae were collected at the indicated time points during liver regeneration. (B) At 0 hpa, Tg(Tp1:H2BmCherry)-positive NRCs were segregated into Tg(Tp1:VenusPEST)−/Alcam− (white arrowhead), Tg(Tp1:VenusPEST)low/Alcam+ (red arrowheads), and Tg(Tp1:VenusPEST)high/Alcam+ (yellow arrowheads) group based on the intensity of Venus and Alcam expression. (C–D’) The proportion of Tg(Tp1:VenusPEST)−/Alcam cells− (white arrowheads) started increasing significantly in the MTZ-treated regenerating livers with a decrease in Tg(Tp1:VenusPEST)low/Alcam+ cells (red arrowheads) at 5–10 hpa. (E, F) At 15 hpa, all the converting CFP-positive NRCs (white arrows) were Tg(Tp1:VenusPEST)−/Alcam− cells with near absence of Tg(Tp1:VenusPEST)low/Alcam+ cells at 25 hpa. Therefore, the Tg(Tp1:VenusPEST)low/Alcam+ (red arrowheads) and Tg(Tp1:VenusPEST)−/Alcam− (white arrowheads) cells experiencing discrete levels of Notch downregulation at early stages of liver regeneration may equate to the transitioning HPCs. (G) Percentage (mean±SD) of Tg(Tp1:VenusPEST)−/Alcam− (0 hpa, 14.8±4.3%; 5 hpa, 34.0±10.6%; 10 hpa, 55.2±15.5%; 15 hpa, 69.1±11.0%; 25 hpa, 81.2±7.5%), Tg(Tp1:VenusPEST)low/Alcam+ (0 hpa, 58.9±11.4%; 5 hpa, 45.3±12.7%; 10 hpa, 26.4±7.5%; 15 hpa, 17.7±1.7%; 25 hpa, 4.5±0.6%), Tg(Tp1:VenusPEST)high/Alcam+ (0 hpa, 26.3±5.6%; 5 hpa, 20.7±2.8%; 10 hpa, 18.4±2.9%; 15 hpa, 13.2±2.8%; 25 hpa, 14.3±2.1%), and Tg(Tp1:VenusPEST)−/Alcam/CFP+ cells (15 hpa, 18.3±1.8%; 25 hpa, 45.7±2.1%) during hepatocyte regeneration. Cells in 5 planes of confocal images from 5 individual larvae were counted at each time point. All images are confocal single-plane images except C’ and D’, which are projection images (n=30 larvae per each time point in three experiments). Scale bars, 20µm. SD, standard deviation.

