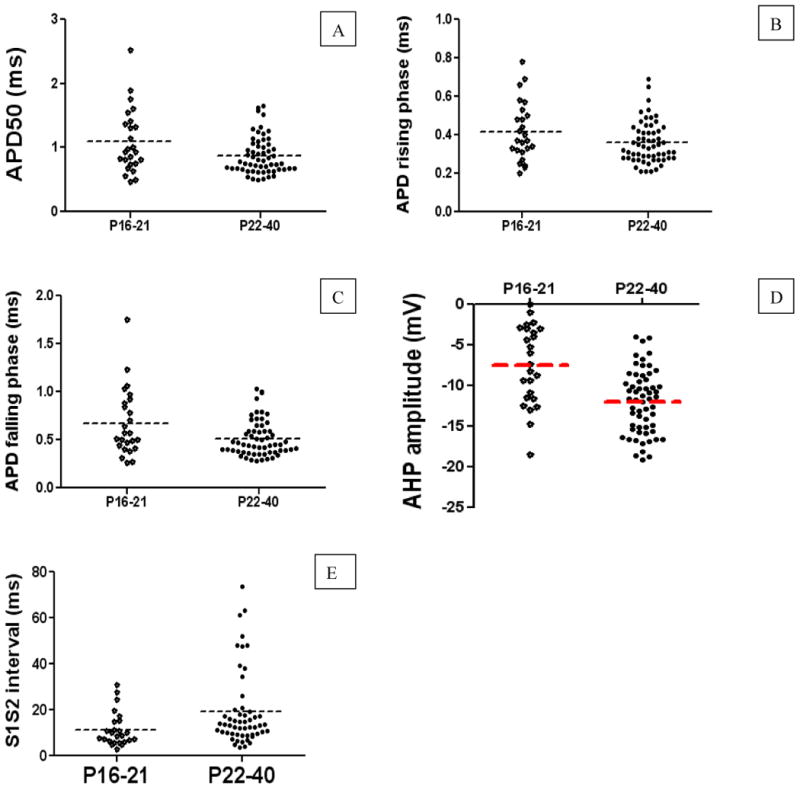
Fig. 2. Developmental changes in APD, AP rising phase, AP falling phase, AHP amplitude, and S1S2 interval.

A-E represent the measurements taken for APD, AP rising phase, AP falling phase, AHP amplitude, and S1S2 interval, respectively. Note that each point in the graphs represents the result from a single neuron, and dash line illustrates the average at a given age. A shortening of APD, AP rising phase, and AP falling phases but increased AHP amplitude, prolonged S1S2 interval were observed in post-weaning group.
