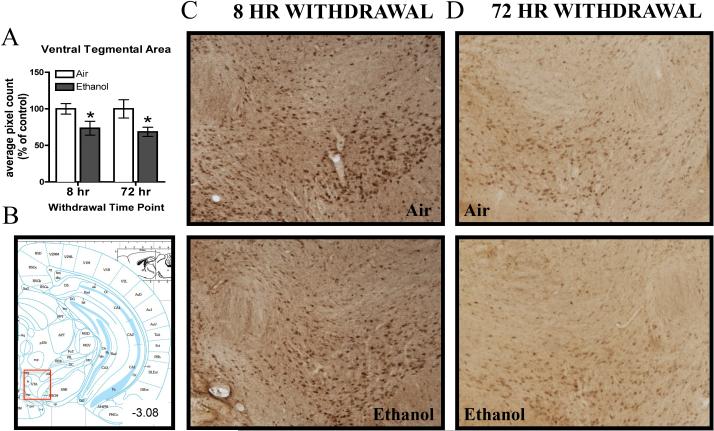
Figure 2.
Effects of CIE exposure on 3α,5α-THP immunoreactivity in the A) VTA 8 hr or 72 hr after withdrawal in air-exposed (clear bars) or ethanol-exposed mice (grey bars). Data depicted are mean positive pixels/mm2 ± SEM. B) Red box indicates coordinates relative to bregma depicted in photomicrographs. C-D) Representative photomicrographs (10×) 3α,5α-THP of immunoreactivity following 8 hr or 72 hr withdrawal in air- (n=11-12) and ethanol-exposed (n=11-13) mice. *p<0.05 compared to respective air-exposed control.

