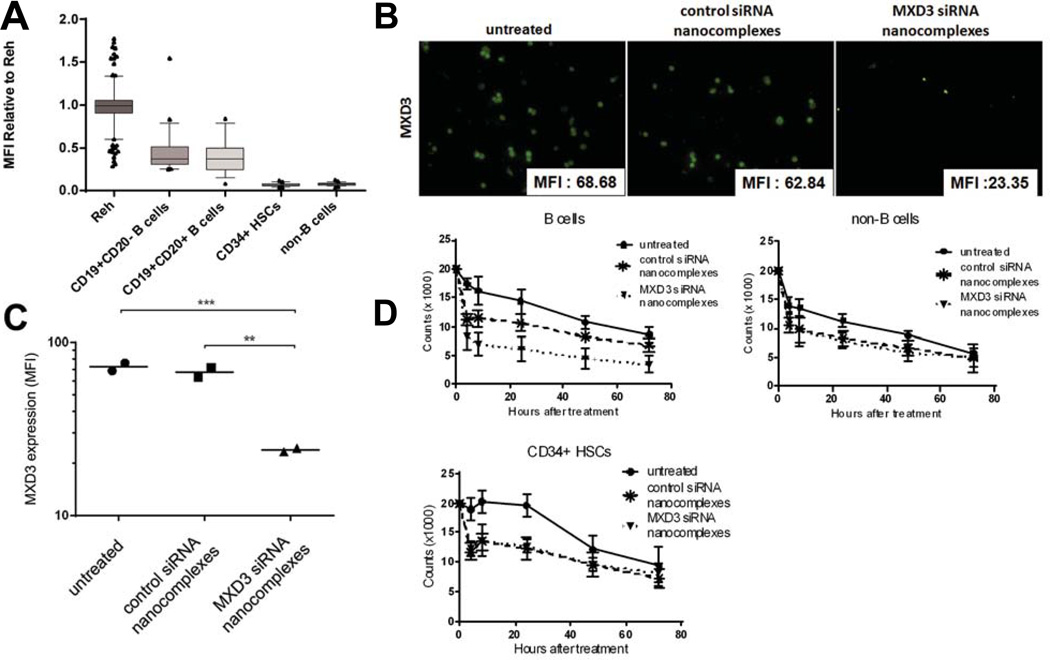
Figure 6. Primary normal B cells, but not CD34+HSCs, express some MXD3, and the MXD3 siRNA-αCD22 Ab-SPIO NP treatment results in MXD3 knockdown and accelerated cell death in vitro.
(A) Some MXD3 protein expression was observed in B cells, but not in CD34+HSCs. Both mature and immature B cells showed less than 50% MXD3 protein expression compared to Reh cells, but CD34+HSCs and non-B cells showed minimal MXD3 expression. Boxes represent MXD3 protein levels in individual cells relative to those in Reh cells, measured by MFI. Bars indicate mean and whiskers, 10–90 percentile represented as individually plotted points.
(B) MXD3 knockdown in the normal B cells treated with the MXD3 siRNA-αCD22 Ab-SPIO NPs at 4 h after treatment. Cells that were treated with the control siRNA-αCD22 Ab-SPIO NPs did not exhibit the same level of MXD3 knockdown. For each image, the protein level was measured by MFI in each cell in the field and the average MFI is shown in the right lower corner of each MXD3 image.
(C) MXD3 protein level measured by MFI. The cells treated with MXD3 siRNA-αCD22 Ab-SPIO NPs showed significantly decreased MXD3 protein expression compared with the cells treated with the control siRNA-αCD22 Ab-SPIO NPs or untreated cells. Each point represents the average MFI of all measured cells per treatment type in triplicates in 2 independent experiments. The MXD3 protein expression was significantly lower in the cells treated with MXD3 siRNA-αCD22 Ab-SPIO NPs than in untreated cells (p = 0.0012) and in cells treated with the control siRNA-αCD22 Ab-SPIO NPs (p = 0.0015) using the Tukey studentized range test in an ANOVA on log(MFI).
(D) Accelerated cell death in the B cells treated with the MXD3 siRNA-αCD22 Ab-SPIO NPs. Data points indicate mean values of independent cell count in triplicates from 2 independent experiments. Live cell count was measured at 4, 8, 24, 48 and 72 h after single treatment with the MXD3 or control siRNA-αCD22 Ab-SPIO NPs. Untreated cells were also used as a control. Data as mean ± SD. For all three cell types, the control and MXD3 siRNA-αCD22 Ab-SPIO NPs differ significantly from the untreated (p < 0.0002 for each of the six comparisons). The MXD3 and control siRNA-αCD22 Ab-SPIO NP treated groups differ significantly in B cell count (p = 0.00003), but not in CD34+HSCs (p = 0.91) or non-B cells (p = 0.96). This analysis used a three-way ANOVA with Treatment, Time, and Experiment Number as factors. The p-values are from the post-hoc Tukey studentized range test.
αCD22 Ab, anti-CD22 antibody; SPIO, superparamagnetic iron oxide; NP, nanoparticle; siRNA, small interfering RNA; MFI, mean fluorescence intensity; SD, standard deviation.

