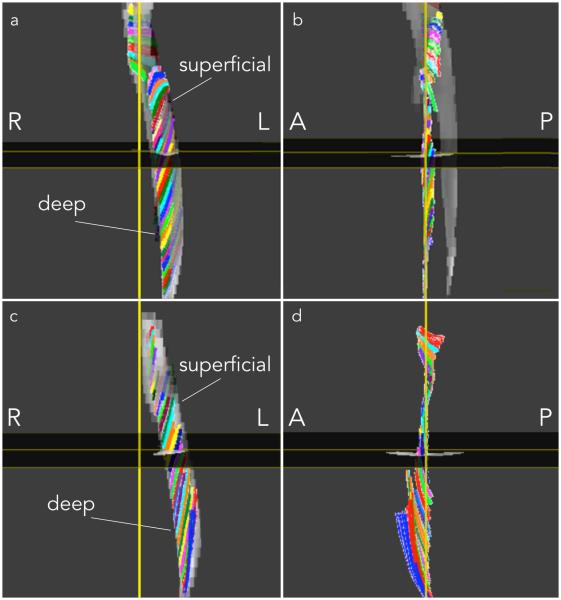
Figure 5.
Medial Gastrocnemius fibers tracked in one subject from the young (a, b) and senior cohort (c, d). Fibers passing through region of interest points selected close to the deep aponeurosis on the coronal reformatted plane extending from distal to proximal are displayed in 3D, viewed from a coronal (a, c) and a sagittal perspective (b, d). ROIs of 1 pixel dimension were selected at each (axial) level to generate the tracts shown below. Colors were assigned randomly to fibers passing through each ROI to facilitate visualization. (R: Right, L: Left, A: Anterior, P: Posterior)

